OPEN-SOURCE SCRIPT
Telah dikemas kini Relative Performance Spread
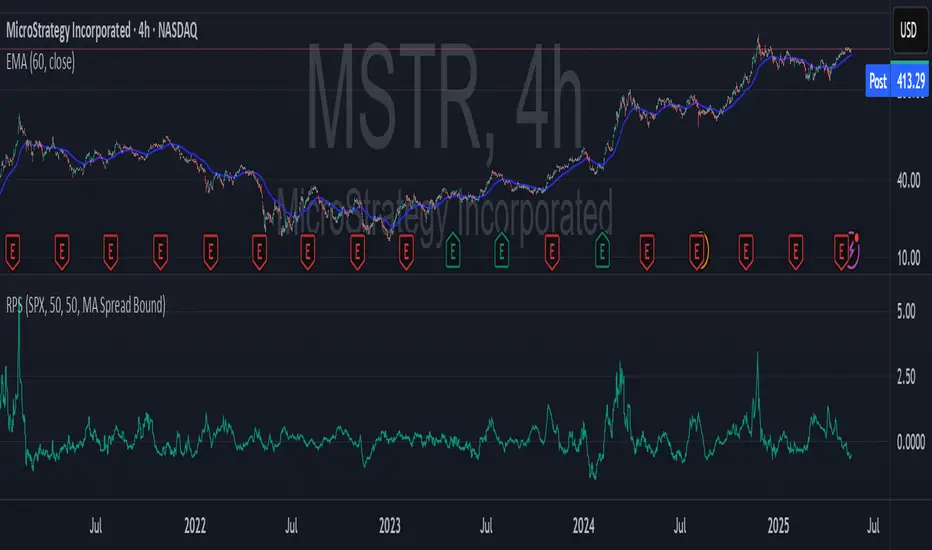
**Relative Performance Spread Indicator – Overview**
This indicator compares the **relative performance between two stocks** by normalizing their prices and calculating the **spread**, **area under the curve (AUC)**, or **normalized price ratio**.
### **How It Works**
* **Input**: Select a second stock (`ticker2`) and a moving average window.
* **Normalization**: Each stock is normalized by its own moving average → `norm = close / MA`.
* **Spread**: The difference `spread = norm1 - norm2` reflects which stock is outperforming.
* **AUC**: Cumulative spread over time shows prolonged dominance or underperformance.
* **Bounds**: Bollinger-style bands are drawn around the spread to assess deviation extremes.
### **Usage**
* **Plot Type Options**:
* `"Spread"`: Spot outperformance; crossing bands may signal rotation.
* `"AUC"`: Track long-term relative trend dominance.
* `"Normalized"`: Directly compare scaled price movements.
Use this tool for **pair trading**, **relative momentum**, or **rotation strategies**. It adapts well across assets with different price scales.
Nota Keluaran
This indicator compares the performance of two stocks by analyzing their deviation from their own moving averages. It offers five plot modes:Spread: Shows the difference between the normalized prices of Stock 1 and Stock 2.
AUC (Area Under Curve): Cumulative spread over time, useful for detecting persistent out/underperformance.
Normalized: Plots each stock’s price relative to its moving average.
Z-Score Spread: Compares standardized deviations to highlight extreme divergences.
MA Spread Bound: Dynamically scales each stock’s deviation within upper/lower EMA bounds for robust comparison.
Skrip sumber terbuka
Dalam semangat TradingView sebenar, pencipta skrip ini telah menjadikannya sumber terbuka, jadi pedagang boleh menilai dan mengesahkan kefungsiannya. Terima kasih kepada penulis! Walaupuan anda boleh menggunakan secara percuma, ingat bahawa penerbitan semula kod ini tertakluk kepada Peraturan Dalaman.
Penafian
Maklumat dan penerbitan adalah tidak bertujuan, dan tidak membentuk, nasihat atau cadangan kewangan, pelaburan, dagangan atau jenis lain yang diberikan atau disahkan oleh TradingView. Baca lebih dalam Terma Penggunaan.