OPEN-SOURCE SCRIPT
Guth_3X_Confirm
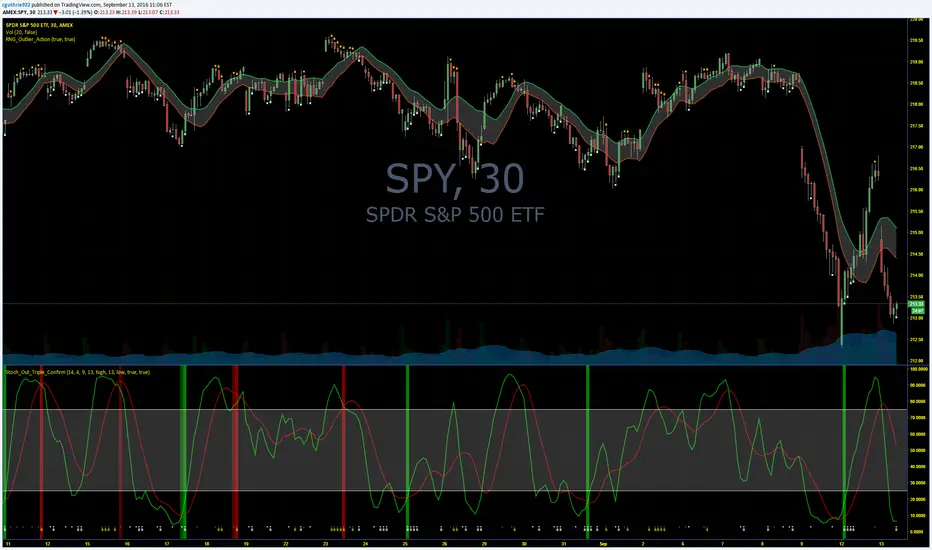
This indicator has three built in indicators based on the SMA of HIGH, SMA of LOW, and Stochastic. The baseline indicator is the retreats after departures from SMA of HIGH and LOW.
The first time a HIGH that is above the SMA HIGH has a lower HIGH but it still above the SMA HIGH, a (-) will appear at the bottom. This signals an aggressive entry point for potential coming downtrend. The second time the HIGH produces a lower high but is still above the SMA HIGH, a (S) will appear at the bottom which signals a more conservative entry point for potential coming downtrend. All of the opposite information is true of reversals beyond the SMA LOW.
When these reversals appear the same time the Stochastic is overbought or oversold, a red bar (overbought and potentially coming down) or a green bar (oversold and potentially coming up) will appear. NOTE: Aggressive symbols occur more often and will always occur when a conservative symbol appears. When a conservative indicator and respective overbought/oversold level occur at the same time, the bar is darker in color.
You can enter positions at any one of the indicators, however, the darker bars are what I look for. This has a high success rate but cannot guarantee results every time. I recommend adjusting the SMA, and Stoch parameters as well as time periods. I have had success with this indicator while day trading the 5, 10, 15, 30, 65 minute periods as well as daily and weekly periods. Every symbol traded can provide differing results based on the parameters used.
Please feel free to leave feedback and I know this can work well for you!
Skrip sumber terbuka
Dalam semangat sebenar TradingView, pencipta skrip ini telah menjadikannya sumber terbuka supaya pedagang dapat menilai dan mengesahkan kefungsiannya. Terima kasih kepada penulis! Walaupun anda boleh menggunakannya secara percuma, ingat bahawa menerbitkan semula kod ini adalah tertakluk kepada Peraturan Dalaman kami.
All forecasts are based on analysis of past behavior. Prior movements are not always indicative of future movement. Develop the theory, test the theory. Do your own research. Nothing in this analysis constitutes advice. YouTube For More. Good luck!!
Penafian
Maklumat dan penerbitan adalah tidak dimaksudkan untuk menjadi, dan tidak membentuk, nasihat untuk kewangan, pelaburan, perdagangan dan jenis-jenis lain atau cadangan yang dibekalkan atau disahkan oleh TradingView. Baca dengan lebih lanjut di Terma Penggunaan.