OPEN-SOURCE SCRIPT
Telah dikemas kini Nasan Moving Average with Forecast
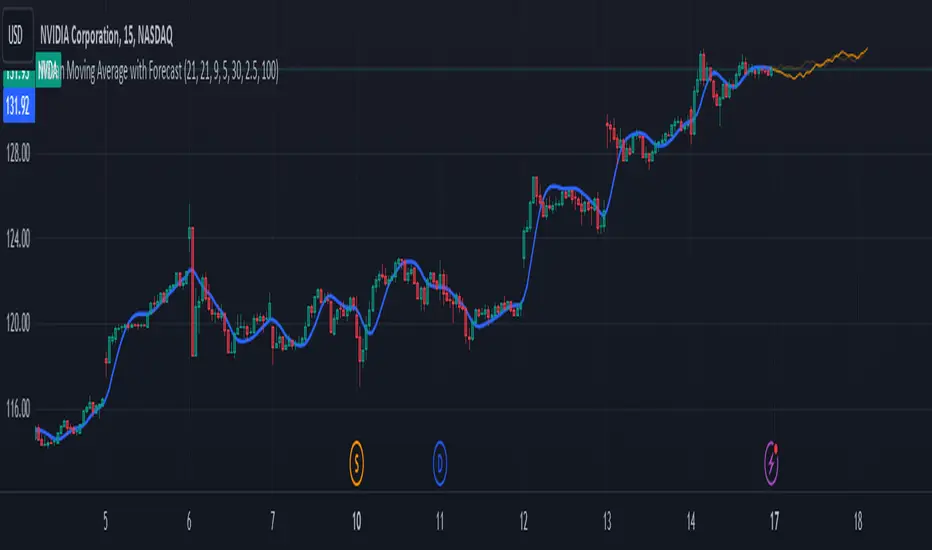
The "Nasan Moving Average with Forecast" indicator is a technical analysis forecasting tool that combines the principles of historical data analysis and random walk theory. It calculates a customized moving average (Nasan Moving Average) by integrating price data and statistical measures and projects future price points by generating forecast values within calculated volatility bounds, creating a dynamic and insightful visualization of potential market movements. This indicator to blend past market behavior with probabilistic future trends to enhance forecasting.
Input Parameters:
len: Differencing length (default 21, Use a minimum of 5 and for lower time frames less than 15 min use values between 300 -3000)
len1: Correction Factor Length 1 (default 21, this determines the length of the MA you want , eg. 10 MA, 50 MA, 100 MA, )
len2: Correction Factor Length 2 (default 9, this works best if it is ~ </=1/2 of len1 )
len3: Smoothing Length (default 5, I would not change this and only use if I want to introduce lag where you want to use it for cross over strategies).
forecast_points: Number of points to forecast (default 30).
m: Multiplier for standard deviation (default 2.5).
bl: Block length for calculating max/min values (default 100).
use_calculated_max_min: Boolean to decide whether to use calculated max/min values.
Nasan Moving Average Calculation:
Calculates the simple moving average (mean) and standard deviation (sd) of the typical price (hlc3).
Computes intermediate variables (a, b, c, etc.) based on log transformation and cumulative sum.
Applies weighted moving averages (wma) to these intermediate variables to smooth them and derive the final value c6.
Plots c6 as the Nasan Moving Average if the bar is confirmed. To learn more see Nasan Moving Average.
Forecast Points Calculation:
Calculates maximum (max_val) and minimum (min_val) values for the forecast, either using a fixed value or based on standard deviation and a multiplier.
Initializes an array to store forecast values and creates polyline objects for plotting.
If the current bar is one of the last three bars and confirmed:
Clears and reinitializes the polyline.
Initializes the first forecast value from the cumulative sum c.
Generates subsequent forecast values using a random value within the range [min_val, max_val].
Updates the forecast array and plots the forecast points as an orange curved polyline.
Plotting Max/Min Values:
Plots max_val and min_val as green and red lines, respectively, to indicate the bounds of the forecast range.
Components of the Forecasting Model
Historical Dependence:
Nasan Moving Average Calculation: The script calculates a custom moving average (c6) that incorporates historical price data (hlc3), standard deviations (sd), and weighted moving averages (wma). This part of the code processes historical data to create a smoothed representation of the price trend.
Max/Min Value Calculation: The maximum (max_val) and minimum (min_val) values for the forecast can be calculated based on the historical standard deviation of a transformed variable b over a block length (bl). This introduces historical volatility into the bounds for the forecast.
Random Walk Model:
Random Value Generation: Within the forecast points calculation, a random value (random_val) is generated for each forecast point within the range [min_val, max_val]. This random value introduces stochasticity into the model, characteristic of a random walk process.
Cumulative Sum for Forecasting: The script uses a cumulative sum (prev_f + random_val) to generate the next forecast point (next_f). This is a typical approach in random walk models where each new point is based on the previous point plus some random noise.
Explanation of the Forecast Model
Random Walk Characteristics: Each new forecast point is generated by adding a random value to the previous point, making the model a random walk with drift, where the drift is influenced by historical correction factors (c1, c4).
Historical and Statistical Dependence: The bounds of the random values and the initial conditions are derived from historical data, ensuring that the forecast respects historical volatility and trends.
The forecasting model in the script is a hybrid approach: It uses a random walk to generate future points, characterized by adding random values to the previous forecasted value.
The historical and statistical dependence is incorporated through initial conditions, scaling factors, and bounds derived from historical price data and its statistical properties.
This combination ensures that the forecasts are not purely stochastic but are grounded in historical price behavior, making the model more robust and potentially more accurate in reflecting market conditions.
Nota Keluaran
The current update incorporates dynamic adjustments of forecast multipliers (m) and block lengths (bl) based on ADX (trend strength) and ATR (volatility). This allows the indicator to adapt to current market conditions dynamically. Additionally, RSI-based coloring provides visual cues for potential trend reversals, enhancing decision-making for traders by highlighting overbought and oversold conditions. Together, these components create a comprehensive tool for technical analysis, aiding in forecasting market movements and identifying critical points for trading decisions.The concept is below.
Adjusting Multiplier m Based on ADX:
Use ADX to adjust m to reflect the confidence in trend strength.
Higher ADX => Decrease m (tighter bounds for the random walk).
Lower ADX => Increase m (wider bounds for the random walk).
Adjusting Block Length bl Based on ATR:
Use ATR to adjust bl to reflect market volatility.
Higher ATR => Decrease bl (shorter block length for more responsiveness).
Lower ATR => Increase bl (longer block length for smoothing).
The ADX and ATR are Min-Max normalized and used as follows to determine multiplier and length dynamically.
Dynamic Multiplier (m_dynamic): This is calculated as 3 - 2 * ADXm, where ADXm is the normalized ADX value. Higher ADX values suggest stronger trends, leading to a smaller m_dynamic, potentially indicating smoother forecast changes.
Dynamic Block Length (bl_dynamic): Calculated as 100 - 70 * ATRm, where ATRm is the normalized ATR value. Higher ATR values indicate higher volatility, resulting in a smaller bl_dynamic, potentially indicating shorter forecast ranges due to increased volatility.
Nota Keluaran
Made an update to ATR calculation. Included volume weighted normalized ATR Skrip sumber terbuka
Dalam semangat TradingView sebenar, pencipta skrip ini telah menjadikannya sumber terbuka, jadi pedagang boleh menilai dan mengesahkan kefungsiannya. Terima kasih kepada penulis! Walaupuan anda boleh menggunakan secara percuma, ingat bahawa penerbitan semula kod ini tertakluk kepada Peraturan Dalaman.
Penafian
Maklumat dan penerbitan adalah tidak bertujuan, dan tidak membentuk, nasihat atau cadangan kewangan, pelaburan, dagangan atau jenis lain yang diberikan atau disahkan oleh TradingView. Baca lebih dalam Terma Penggunaan.
Skrip sumber terbuka
Dalam semangat TradingView sebenar, pencipta skrip ini telah menjadikannya sumber terbuka, jadi pedagang boleh menilai dan mengesahkan kefungsiannya. Terima kasih kepada penulis! Walaupuan anda boleh menggunakan secara percuma, ingat bahawa penerbitan semula kod ini tertakluk kepada Peraturan Dalaman.
Penafian
Maklumat dan penerbitan adalah tidak bertujuan, dan tidak membentuk, nasihat atau cadangan kewangan, pelaburan, dagangan atau jenis lain yang diberikan atau disahkan oleh TradingView. Baca lebih dalam Terma Penggunaan.