OPEN-SOURCE SCRIPT
Waddah Attar Explosion [LazyBear]
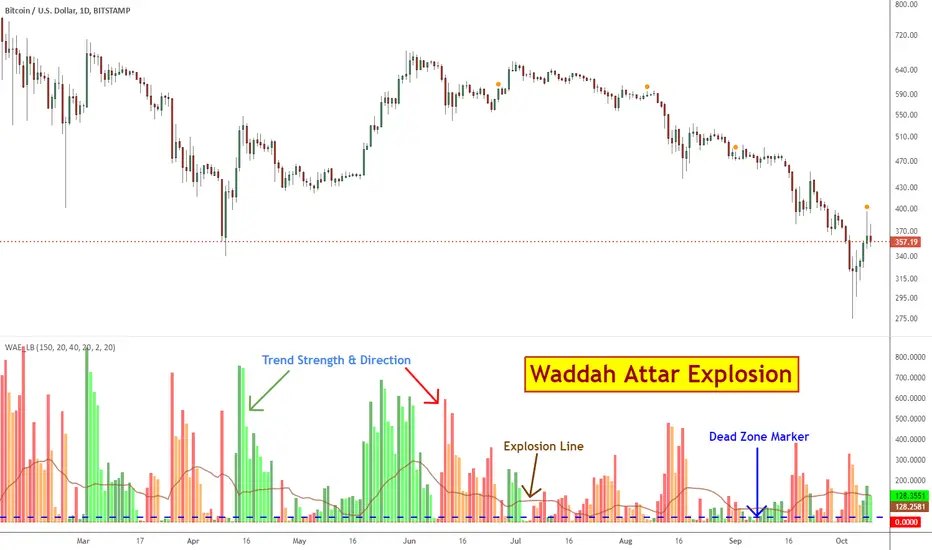
This is a port of a famous MT4 indicator, as requested by user @maximus71. This indicator uses MACD/BB to track trend direction and strength. Author suggests using this indicator on 30mins.
Explanation from the indicator developer:
"Various components of the indicator are:
Dead Zone Line: Works as a filter for weak signals. Do not trade when the red or green histogram is below it.
Histograms:
- Red histogram shows the current down trend.
- Green histogram shows the current up trend.
- Sienna line shows the explosion in price up or down.
Signal for ENTER_BUY: All the following conditions must be met.
- Green histo is raising.
- Green histo above Explosion line.
- Explosion line raising.
- Both green histo and Explosion line above DeadZone line.
Signal for EXIT_BUY: Exit when green histo crosses below Explosion line.
Signal for ENTER_SELL: All the following conditions must be met.
- Red histo is raising.
- Red histo above Explosion line.
- Explosion line raising.
- Both red histo and Explosion line above DeadZone line.
Signal for EXIT_SELL: Exit when red histo crosses below Explosion line. "
All of the parameters are configurable via options page. You may have to tune it for your instrument.
More info:
Author note: forex-tsd.com/metatrader-4/6022-waddah-attar-explosion-indicator-2.html
Video (French): youtube.com/watch?v=oLxa-XcenrI
List of my other indicators:
- GDoc: docs.google.com/document/d/15AGCufJZ8CIUvwFJ9W-IKns88gkWOKBCvByMEvm5MLo/edit?usp=sharing
- Chart: tradingview.com/v/4IneGo8h/
Skrip sumber terbuka
Dalam semangat sebenar TradingView, pencipta skrip ini telah menjadikannya sumber terbuka supaya pedagang dapat menilai dan mengesahkan kefungsiannya. Terima kasih kepada penulis! Walaupun anda boleh menggunakannya secara percuma, ingat bahawa menerbitkan semula kod ini adalah tertakluk kepada Peraturan Dalaman kami.
List of my free indicators: bit.ly/1LQaPK8
List of my indicators at Appstore: blog.tradingview.com/?p=970
List of my indicators at Appstore: blog.tradingview.com/?p=970
Penafian
Maklumat dan penerbitan adalah tidak dimaksudkan untuk menjadi, dan tidak membentuk, nasihat untuk kewangan, pelaburan, perdagangan dan jenis-jenis lain atau cadangan yang dibekalkan atau disahkan oleh TradingView. Baca dengan lebih lanjut di Terma Penggunaan.