OPEN-SOURCE SCRIPT
Chaikin Money Flow (CMF) [ParadoxAlgo]

OVERVIEW
This indicator implements the Chaikin Money Flow oscillator as an overlay on the price chart, designed to help traders identify institutional money flow patterns. The Chaikin Money Flow combines price and volume data to measure the flow of money into and out of a security, making it particularly useful for detecting accumulation and distribution phases.
WHAT IS CHAIKIN MONEY FLOW?
Chaikin Money Flow was developed by Marc Chaikin and measures the amount of Money Flow Volume over a specific period. The indicator oscillates between +1 and -1, where:
CALCULATION METHOD
KEY FEATURES
Big Money Detection:
Visual Elements:
Customizable Parameters:
INTERPRETATION
Signal Types:
Dashboard Information:
TRADING APPLICATIONS
PARAMETER RECOMMENDATIONS
ALERTS
Optional alert system notifies users when:
LIMITATIONS
EDUCATIONAL PURPOSE
This open-source indicator is provided for educational purposes to help traders understand money flow analysis. It demonstrates the practical application of the Chaikin Money Flow concept with visual enhancements for easier interpretation.
TECHNICAL SPECIFICATIONS
Overlay indicator (displays on price chart)
No repainting - all calculations are based on closed bar data
Suitable for all timeframes and asset classes
Minimal resource usage for optimal performance
DISCLAIMER
This indicator is for educational and informational purposes only. Past performance does not guarantee future results. Always conduct your own analysis and consider risk management before making trading decisions.
This indicator implements the Chaikin Money Flow oscillator as an overlay on the price chart, designed to help traders identify institutional money flow patterns. The Chaikin Money Flow combines price and volume data to measure the flow of money into and out of a security, making it particularly useful for detecting accumulation and distribution phases.
WHAT IS CHAIKIN MONEY FLOW?
Chaikin Money Flow was developed by Marc Chaikin and measures the amount of Money Flow Volume over a specific period. The indicator oscillates between +1 and -1, where:
- Positive values indicate money flowing into the security (accumulation)
- Negative values indicate money flowing out of the security (distribution)
- Values near zero suggest equilibrium between buying and selling pressure
CALCULATION METHOD
- Money Flow Multiplier = ((Close - Low) - (High - Close)) / (High - Low)
- Money Flow Volume = Money Flow Multiplier × Volume
- CMF = Sum of Money Flow Volume over N periods / Sum of Volume over N periods
KEY FEATURES
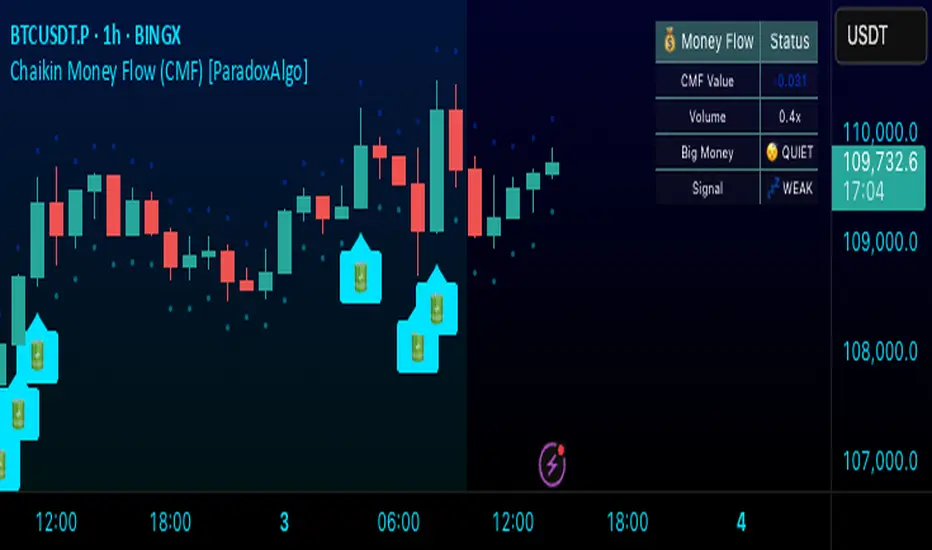
Big Money Detection:
- Identifies significant institutional activity when CMF exceeds user-defined thresholds
- Requires volume confirmation (volume above average) to validate signals
- Uses battery icon (🔋) for institutional buying and lightning icon (⚡) for institutional selling
Visual Elements:
- Background coloring based on money flow direction
- Support and resistance levels calculated using Average True Range
- Real-time dashboard showing current CMF value, volume strength, and signal status
Customizable Parameters:
- CMF Period: Calculation period for the money flow (default: 20)
- Signal Smoothing: EMA smoothing applied to reduce noise (default: 5)
- Big Money Threshold: CMF level required to trigger institutional signals (default: 0.15)
- Volume Threshold: Volume multiplier required for signal confirmation (default: 1.5x)
INTERPRETATION
Signal Types:
- 🔋 (Battery): Indicates strong institutional buying when CMF > threshold with high volume
- ⚡ (Lightning): Indicates strong institutional selling when CMF < -threshold with high volume
- Background color: Green tint for positive money flow, red tint for negative money flow
Dashboard Information:
- CMF Value: Current Chaikin Money Flow reading
- Volume: Current volume as a multiple of 20-period average
- Big Money: Status of institutional activity (BUYING/SELLING/QUIET)
- Signal: Strength assessment (STRONG/MEDIUM/WEAK)
TRADING APPLICATIONS
- Trend Confirmation: Use CMF direction to confirm price trends
- Divergence Analysis: Look for divergences between price and money flow
- Volume Validation: Confirm breakouts with corresponding money flow
- Accumulation/Distribution: Identify phases of institutional activity
PARAMETER RECOMMENDATIONS
- Day Trading: CMF Period 14-21, higher sensitivity settings
- Swing Trading: CMF Period 20-30, moderate sensitivity
- Position Trading: CMF Period 30-50, lower sensitivity for major trends
ALERTS
Optional alert system notifies users when:
- Big money buying is detected (CMF above threshold with volume confirmation)
- Big money selling is detected (CMF below negative threshold with volume confirmation)
LIMITATIONS
- May generate false signals in low-volume conditions
- Best used in conjunction with other technical analysis tools
- Effectiveness varies across different market conditions and timeframes
EDUCATIONAL PURPOSE
This open-source indicator is provided for educational purposes to help traders understand money flow analysis. It demonstrates the practical application of the Chaikin Money Flow concept with visual enhancements for easier interpretation.
TECHNICAL SPECIFICATIONS
Overlay indicator (displays on price chart)
No repainting - all calculations are based on closed bar data
Suitable for all timeframes and asset classes
Minimal resource usage for optimal performance
DISCLAIMER
This indicator is for educational and informational purposes only. Past performance does not guarantee future results. Always conduct your own analysis and consider risk management before making trading decisions.
Skrip sumber terbuka
Dalam semangat TradingView sebenar, pencipta skrip ini telah menjadikannya sumber terbuka, jadi pedagang boleh menilai dan mengesahkan kefungsiannya. Terima kasih kepada penulis! Walaupuan anda boleh menggunakan secara percuma, ingat bahawa penerbitan semula kod ini tertakluk kepada Peraturan Dalaman.
Penafian
Maklumat dan penerbitan adalah tidak bertujuan, dan tidak membentuk, nasihat atau cadangan kewangan, pelaburan, dagangan atau jenis lain yang diberikan atau disahkan oleh TradingView. Baca lebih dalam Terma Penggunaan.