PROTECTED SOURCE SCRIPT
Buy Sell Indicator by Independent Researcher
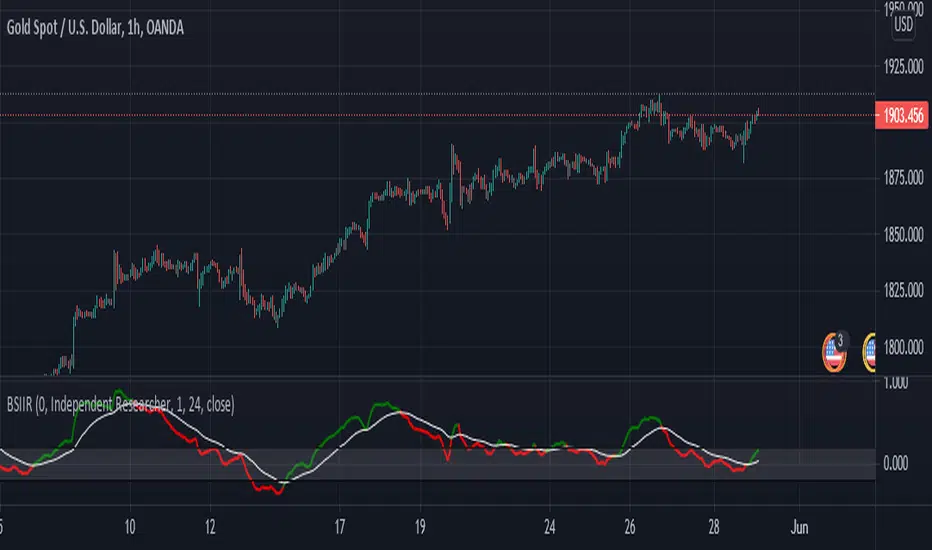
This is an Buy and Sell Oscillator. Its show the trend reversal or change in price action of the market. This indicator is a combination of various moving averages. This is like a MACD but a very powerful version.
How To Use It
Below you will see an example:-
XAUUSD

EURUSD

How To Use It
- If green line gives crossover white line towards down then price is expected to fall.
- If red line gives crossover white line towards up then price is expected to rise.
- For better results of indicator trade after closing of crossover candle.
- There is a band +.20 to -.20 for better results trade on crossover happens between that band.
Below you will see an example:-
XAUUSD
EURUSD
Skrip dilindungi
Skrip ini diterbitkan sebagai sumber tertutup. Akan tetapi, anda boleh menggunakannya secara bebas dan tanpa apa-apa had – ketahui lebih di sini.
Penafian
Maklumat dan penerbitan adalah tidak bertujuan, dan tidak membentuk, nasihat atau cadangan kewangan, pelaburan, dagangan atau jenis lain yang diberikan atau disahkan oleh TradingView. Baca lebih dalam Terma Penggunaan.