OPEN-SOURCE SCRIPT
Telah dikemas kini SPY Trend-Based Buy Signals
🔹 Overview
This indicator identifies potential buy signals on any asset by combining MACD and Stochastic Oscillator crossovers, while using the SPY’s trend (via exponential moving averages) as a broader market filter.
It helps traders stay aligned with macro momentum and avoid counter-trend entries.
🔍 How it works
SPY Trend Filter (Daily Timeframe):
Pulls SPY (S&P 500 ETF) data using EMAs (5, 20, 80)
Categorizes SPY market trend with color codes:
🟢 Green: Strong uptrend (EMA5 > EMA20 > EMA80)
🟡 Yellow: Potential uptrend / early momentum (EMA5 < EMA20 > EMA80)
🔴 Red: Downtrend (EMA5 < EMA20 < EMA80)
🔵 Blue: Possible trend reversal or mixed trend (EMA5 > EMA20 < EMA80)
Buy Signal Conditions (Combined Logic):
A signal is only triggered when:
- SPY trend is either yellow or blue (indicating a neutral-to-bullish or early recovery environment)
-The Stochastic Oscillator's %D line is below 50, showing possible upside
- A bullish MACD crossover occurs on the current symbol
🟢 Green signal: MACD crossover occurs below 0 (early reversal)
🟠 Orange signal: MACD crossover occurs above 0 (momentum continuation)
📈 Visual Output
🟢 Green label below the bar when an early reversal setup occurs
🟠 Orange label above the bar when a trend continuation signal appears
✅ Best Use Case
Ideal for:
Swing traders and position traders
LEAPS (long-term options) traders aligning entries with SPY trend
Anyone seeking clean, contextual entries filtered by market momentum
⚠️ Note: This indicator is most effective when used on fundamentally strong stocks that are sector leaders with solid earnings growth and market presence. Use technical signals as a complement to quality fundamentals.
ℹ️ Clarification: The moving averages displayed on the chart (e.g., on QQQ) are for visual reference only, to help users understand the color logic of the SPY trend filter. The actual logic and signals are based on SPY’s moving averages, regardless of the charted symbol.
Nota Keluaran
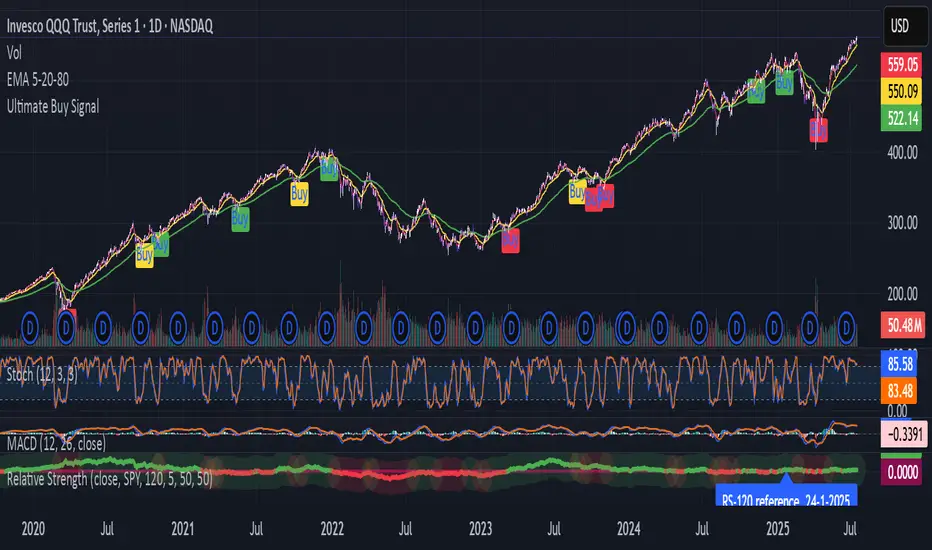
Ultimate Buy Signal is a multi-factor momentum-based indicator designed to identify high-probability long entries by combining market breadth, trend confirmation, and relative strength. This tool aims to help traders spot optimal buy zones with improved timing and context.📊 Core Components:
SPY Trend Momentum:
Uses 5, 20, and 80 EMA of the SPY (S&P 500 ETF) on the daily timeframe to evaluate the overall market trend.
The histogram color reflects the momentum regime:
✅ Green: Strong bullish trend (5 > 20 > 80 EMA)
🟡 Yellow: Weakening momentum
🔴 Red: Bearish trend
🔷 Blue: Early recovery phase
Stochastic Filter:
Entry signals are filtered to only occur when the smoothed stochastic (K and D) is below 50, highlighting short-term oversold conditions.
MACD Crossover:
Buy signals only trigger when a bullish MACD crossover occurs, adding a momentum confirmation layer.
Relative Strength (RS) vs SPY:
A proprietary RS formula compares the asset’s performance to SPY over a 60-bar lookback.
An additional filter detects bullish divergence (via SMA rising and price above SMA) to capture early rotations.
Buy Signal Logic:
A buy label appears below the candle when all conditions align:
SPY histogram momentum
MACD crossover
Stochastic below 50
RS confirmation
🟩 Color-Coded Buy Labels:
Each buy label color reflects the market's trend regime via SPY momentum:
Green = Strong trend
Yellow = Moderate risk
Red = Aggressive entry
Turquoise = Early trend shift
Nota Keluaran
Description:This script combines several proven technical indicators to detect high-probability buy signals during favorable market conditions. It is designed to work on any stock or ETF but uses SPY (S&P 500 ETF) as a benchmark for global momentum and relative strength.
📈 How it works:
📊 Core Components:
1. SPY Trend Momentum:
Uses 5, 20, and 80 EMA of the SPY (S&P 500 ETF) on the daily timeframe to evaluate the overall market trend.
The histogram color reflects the momentum regime:
✅ Green: Strong bullish trend (5 > 20 > 80 EMA)
🟡 Yellow: Weakening momentum
🔴 Red: Bearish trend
🔷 Blue: Early recovery phase
2. MACD Crossover:
Buy signals only trigger when a bullish MACD crossover occurs, adding a momentum confirmation layer.
3. Stochastic Filter:
Entry signals are filtered to only occur when the smoothed stochastic (K and D) is below 50, highlighting short-term oversold conditions.
4. Relative Strength (RS) vs SPY:
A proprietary RS formula compares the asset’s performance to SPY over a 120-bar lookback.
The indicator looks for assets that outperform the SPY, indicating stronger bullish potential. We aim for high relative strength versus the index, so the stock has enough momentum to help pull the index upward, not just follow it.
An additional filter detects bullish divergence (via SMA rising and price above SMA) to capture early rotations.
Signal Combination:
A buy signal appears when:
SPY momentum filter is favorable (green, yellow, red or blue)
MACD crossover is bullish
Stochastic is below 50
RS is positive or bullish divergence is detected
🟩 Color-Coded Buy Labels:
Each buy label color reflects the market's trend regime via SPY momentum:
Green = Strong trend
Yellow = Moderate risk
Red = Aggressive entry
Turquoise = Early trend shift
✅ A buy signal appears when market momentum, price action, and relative strength are all aligned to favor a bullish move.
📉 Risk Management Tip: A stop-loss should be placed below the most recent swing support related to the entry signal, as no trade setup is immune to market reversals.
⚠️ Limitations:
This script is not well-suited for sharp V-shaped recoveries or strong rebounds immediately following deep sell-offs. Since it relies on confirmation from smoothed trend and momentum indicators, it often triggers signals with a delay in fast reversal scenarios.
Skrip sumber terbuka
Dalam semangat TradingView sebenar, pencipta skrip ini telah menjadikannya sumber terbuka, jadi pedagang boleh menilai dan mengesahkan kefungsiannya. Terima kasih kepada penulis! Walaupuan anda boleh menggunakan secara percuma, ingat bahawa penerbitan semula kod ini tertakluk kepada Peraturan Dalaman.
Penafian
Maklumat dan penerbitan adalah tidak bertujuan, dan tidak membentuk, nasihat atau cadangan kewangan, pelaburan, dagangan atau jenis lain yang diberikan atau disahkan oleh TradingView. Baca lebih dalam Terma Penggunaan.