OPEN-SOURCE SCRIPT
Telah dikemas kini [blackcat] L2 Low TF Pivot Forecast
Level 2
Background
A algo for pivot points forecast for each bar and its low tf data.
Function
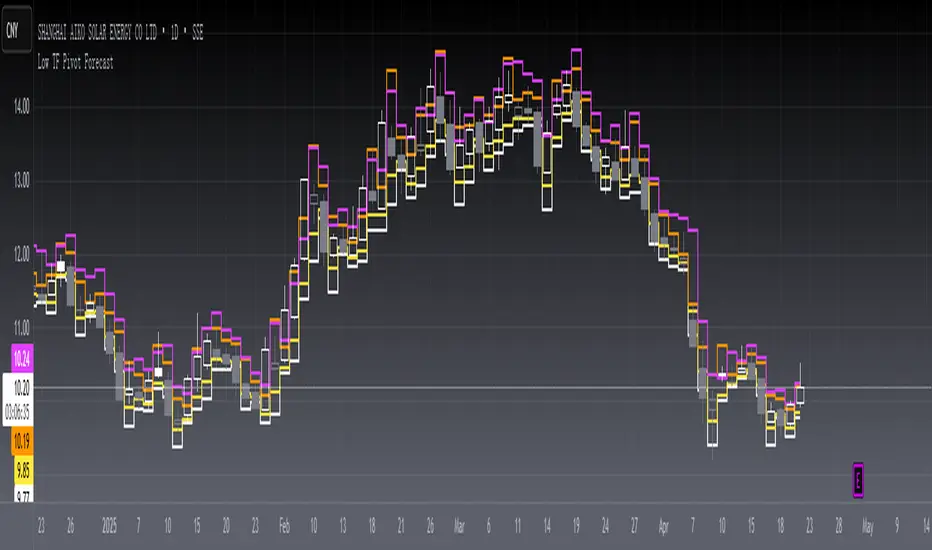
In financial markets, a pivot point is a price level that is used by traders as an indicator of market movement. Pivot points are averaged from important prices (highest, lowest, closing) based on the market performance of the previous time period. There are many ways to calculate the pivot point. The pivot point is calculated using the highest price (H), the lowest price (L) and the closing price (C) of the previous time period, and sometimes the opening price of the current time period Valence (O) was added to it.
S1 yellow
S2 white
R1 Orange
R2 fuchsia
The smoothing parameter default to 55
The pivot point indicator can be used in two ways. First, the pivot point can be used as a price trend confirmation. It is generally believed that if the price is above the pivot point in the latter period of time, the market is considered to be in a bull market sentiment, otherwise it is considered to be in a bear market sentiment. Second, support and resistance levels are mainly used as exit positions. For example, R1 and R2 can be used as trade targets if the market price breaks above a pivot point. If the market effectively breaks R1 and R2, traders may consider adding to their long positions.
Remarks
Feedbacks are appreciated.
Background
A algo for pivot points forecast for each bar and its low tf data.
Function
In financial markets, a pivot point is a price level that is used by traders as an indicator of market movement. Pivot points are averaged from important prices (highest, lowest, closing) based on the market performance of the previous time period. There are many ways to calculate the pivot point. The pivot point is calculated using the highest price (H), the lowest price (L) and the closing price (C) of the previous time period, and sometimes the opening price of the current time period Valence (O) was added to it.
S1 yellow
S2 white
R1 Orange
R2 fuchsia
The smoothing parameter default to 55
The pivot point indicator can be used in two ways. First, the pivot point can be used as a price trend confirmation. It is generally believed that if the price is above the pivot point in the latter period of time, the market is considered to be in a bull market sentiment, otherwise it is considered to be in a bear market sentiment. Second, support and resistance levels are mainly used as exit positions. For example, R1 and R2 can be used as trade targets if the market price breaks above a pivot point. If the market effectively breaks R1 and R2, traders may consider adding to their long positions.
Remarks
Feedbacks are appreciated.
Nota Keluaran
OVERVIEWThe L2 Low TF Pivot Forecast indicator provides traders with dynamic support and resistance levels based on recent price action. This advanced tool calculates multiple pivot points and levels using both simple and exponential smoothing techniques, making it particularly useful for intraday trading strategies. The indicator helps identify potential reversal zones and breakout targets, allowing traders to make more informed decisions about entry and exit points 📈.
FEATURES
• Calculates four distinct levels:
Support Level 2 (S2)
Support Level 1 (S1)
Resistance Level 1 (R1)
Resistance Level 2 (R2)
• Uses adaptive smoothing period for dynamic level adjustments 🔄
• Incorporates price volatility metrics for more accurate level placement 💰
• Displays levels in real-time on the chart overlay ✨
HOW TO USE
Apply the indicator to your desired timeframe chart 🔍
Adjust the Smooth Period parameter (default: 55) to fine-tune level sensitivity ⚙️
Monitor price action against support and resistance levels
Look for potential breakouts or reversals at these levels 🎯
LIMITATIONS
• May generate false signals during highly volatile markets ⚠️
• Best suited for lower timeframes analysis 🔁
• Results may vary across different market conditions 🌡️
NOTES
This indicator combines traditional pivot point calculations with modern technical analysis methods to provide traders with actionable insights. It's particularly effective when used alongside other indicators for confirmation signals 🤝.
Skrip sumber terbuka
Dalam semangat TradingView sebenar, pencipta skrip ini telah menjadikannya sumber terbuka, jadi pedagang boleh menilai dan mengesahkan kefungsiannya. Terima kasih kepada penulis! Walaupuan anda boleh menggunakan secara percuma, ingat bahawa penerbitan semula kod ini tertakluk kepada Peraturan Dalaman.
Avoid losing contact!Don't miss out! The first and most important thing to do is to join my Discord chat now! Click here to start your adventure: discord.com/invite/ZTGpQJq 防止失联,请立即行动,加入本猫聊天群: discord.com/invite/ZTGpQJq
Penafian
Maklumat dan penerbitan adalah tidak bertujuan, dan tidak membentuk, nasihat atau cadangan kewangan, pelaburan, dagangan atau jenis lain yang diberikan atau disahkan oleh TradingView. Baca lebih dalam Terma Penggunaan.