PROTECTED SOURCE SCRIPT
Flow
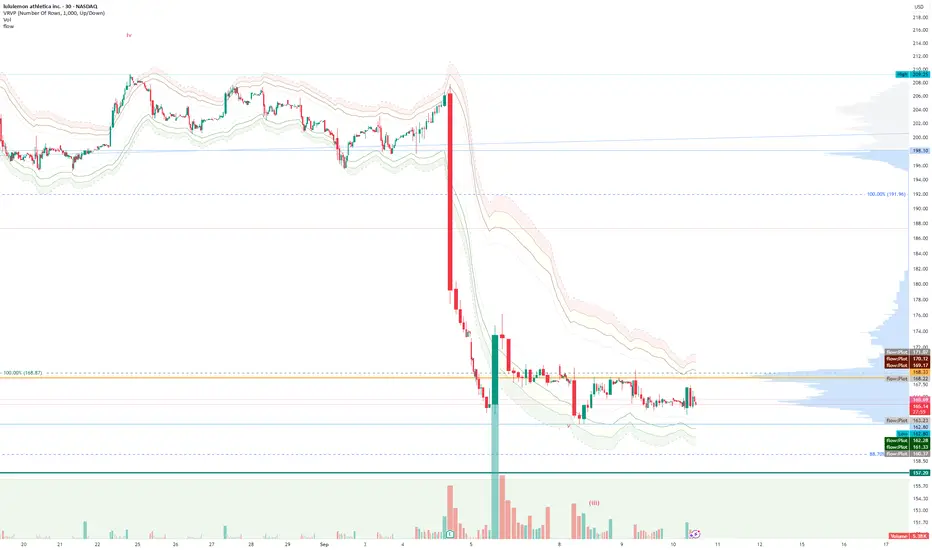
The indicator attempts to capture the volatility within a range and apply a set of Fibonacci calculations to display a range of bands of varying degrees which represents zones where exhaustion may occur on both sides.
So if price gets in to the yellow or pink zones then the script author is on high alert for a reversal. It must be noted that the user of the script should be fluent in Elliott Wave Analysis as the script was developed to help the author determine if a wave sequence may have ended.
When the indicator glides along one of the green, yellow or pink bands, then the instrument is likely in a 3rd wave, in Elliott wave speak, as such the user of the script would wait and not try to fade the move up or down as continuation is likely. Instead a move away from one of the bands should indicate another attempt at reaching the band after moving away. Thus, this move back in should be a 5th wave of some degree within the timeframe.
The indicator is not bound to any timeframe, as such it works on a 1 minute chart as it does on a weekly timeframe.
One of the observations the author makes is the use of the indicator within a sideways market. The indicator performs very well within these lower volatility environments by indicating exhaustion within these range bound markets.
So in essence, within the framework of Elliott wave analysis and respective time frames. Watch several higher and lower time frames.
1) Once wave 1 has completed
2) Look for a move down to the lower green / yellow zone to identify a wave 2 zone.
3) Once wave 3 starts, do not attempt to fade or short the first touch on the pink zone. Wait for price to move away and then come back in to the pink zone before considering a top and any attempts to fade.
4) Wave 4 should find support on the lower yellow or green band. Where it may be considered that price may change direction.
5) Depending on the time frame and any expected/unexpected extensions, Wave 5 may find resistance in to the pink zone.
A question that the author often asks is "where will wave 3 end?" - Will it end at the 1.618% extension of wave 1 & 2, the 176.4 or higher and perhaps lower. Using the pink zones the author has found it useful and quite accurate to make such a judgement based on the current position of the bands - Pink for exhaustion in an uptrend and green for exhaustion in a down trending market.
Skrip dilindungi
Skrip ini diterbitkan sebagai sumber tertutup. Akan tetapi, anda boleh menggunakannya secara bebas dan tanpa apa-apa had – ketahui lebih di sini.
Student of the market since 2011. Technical analyst using some fundamentals, Elliott Wave Analysis, Volume Profiling, Supply & Demand and 'Flow' - my own indicator.
Penafian
Maklumat dan penerbitan adalah tidak bertujuan, dan tidak membentuk, nasihat atau cadangan kewangan, pelaburan, dagangan atau jenis lain yang diberikan atau disahkan oleh TradingView. Baca lebih dalam Terma Penggunaan.