OPEN-SOURCE SCRIPT
MA Oscillator Map [ChartPrime]

⯁ OVERVIEW
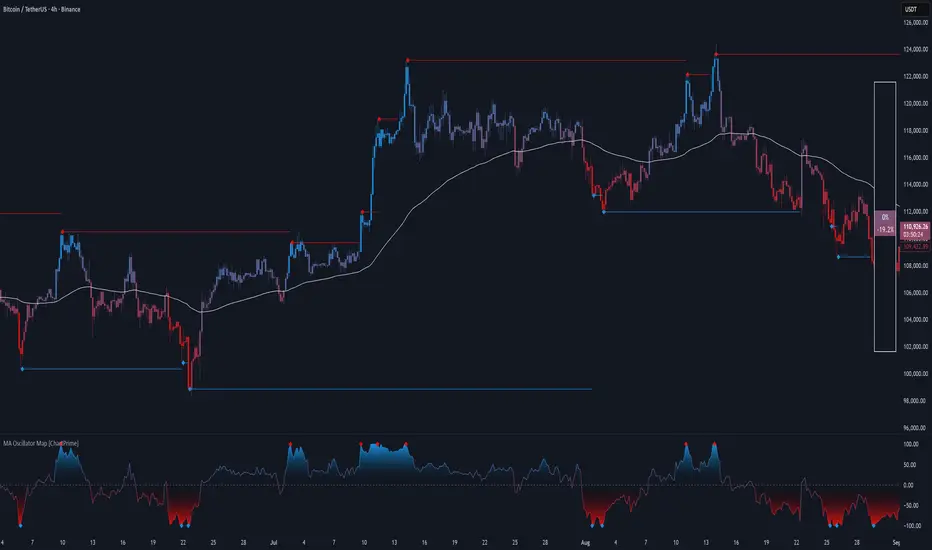
The MA Oscillator Map [ChartPrime] transforms moving average deviations into an oscillator framework that highlights overextended price conditions. By normalizing the difference between price and a chosen moving average, the tool maps oscillations between -100 and +100, with gradient coloring to emphasize bullish and bearish momentum. When the oscillator cools from extreme levels (-100/100), the indicator marks potential reversal points and extends short-term levels from those extremes. A compact side table and dynamic bar coloring make momentum context visible at a glance.
⯁ KEY FEATURES
⯁ USAGE
⯁ CONCLUSION
The MA Oscillator Map reframes moving average deviations into a visual momentum tracker with extremes, reversal signals, and dynamic levels. By blending oscillator math with intuitive visuals like gradient candles, diamonds, and a live gauge, it helps traders spot overextension, exhaustion, and momentum shifts across any market.
The MA Oscillator Map [ChartPrime] transforms moving average deviations into an oscillator framework that highlights overextended price conditions. By normalizing the difference between price and a chosen moving average, the tool maps oscillations between -100 and +100, with gradient coloring to emphasize bullish and bearish momentum. When the oscillator cools from extreme levels (-100/100), the indicator marks potential reversal points and extends short-term levels from those extremes. A compact side table and dynamic bar coloring make momentum context visible at a glance.
⯁ KEY FEATURES
- Oscillator Mapping (±100 Scale):
Price deviation from the selected MA is normalized into a percentage scale, allowing consistent overbought/oversold readings across assets and timeframes.Pine Script® // MA MA = ma(close, maLengthInput, maTypeInput) diff = src - MA maxVal = ta.highest(math.abs(diff), 50) osc = diff / maxVal * 100 - Customizable MA Types:
Choose SMA, EMA, SMMA, WMA, or VWMA to fine-tune the smoothing method that powers the oscillator. - Extreme Signal Diamonds:
When the oscillator retreats from +100 or -100, the script plots diamonds to flag potential exhaustion and reversal zones. - Dynamic Levels from Extremes:
Upper and lower dotted lines extend from recent overextension points, projecting temporary barriers until broken by price. - Gradient Bar Coloring:
Candles and oscillator values adopt a bullish-to-bearish gradient, making shifts in momentum instantly visible on the chart. - Compact Momentum Map:
A table at the chart’s edge plots the oscillator position with a gradient scale and live percentage label for precise momentum tracking.
⯁ USAGE
- Watch for diamonds after the oscillator exits ±100 — these mark potential exhaustion zones.
- Use extended dotted levels as short-term reference lines; if broken, trend continuation is favored.
- Combine gradient bar coloring with oscillator shifts for confirmation of momentum reversals.
- Experiment with different MA types to adapt sensitivity for trending vs. ranging markets.
- Use the side momentum table as a quick-read gauge of trend strength in percent terms.
⯁ CONCLUSION
The MA Oscillator Map reframes moving average deviations into a visual momentum tracker with extremes, reversal signals, and dynamic levels. By blending oscillator math with intuitive visuals like gradient candles, diamonds, and a live gauge, it helps traders spot overextension, exhaustion, and momentum shifts across any market.
Skrip sumber terbuka
Dalam semangat TradingView sebenar, pencipta skrip ini telah menjadikannya sumber terbuka, jadi pedagang boleh menilai dan mengesahkan kefungsiannya. Terima kasih kepada penulis! Walaupuan anda boleh menggunakan secara percuma, ingat bahawa penerbitan semula kod ini tertakluk kepada Peraturan Dalaman.
Penafian
Maklumat dan penerbitan adalah tidak bertujuan, dan tidak membentuk, nasihat atau cadangan kewangan, pelaburan, dagangan atau jenis lain yang diberikan atau disahkan oleh TradingView. Baca lebih dalam Terma Penggunaan.