Dolores
The "Dolores Trading Assistant" is a sleek and intuitive indicator designed to empower traders during the high-volatile New York trading session. This tool overlays a customizable table on your chart, presenting real-time insights from key market internals—NYSE and Nasdaq Advance/Decline (A/D), Volume Difference (VOLD), and TICK—in a clear, color-coded format. Its streamlined design focuses on delivering essential market data with trend states, making it a practical companion for assessing momentum and sentiment at a glance.
Purpose and Usefulness
Tailored for intraday traders, the Dolores Trading Assistant goes beyond price-based analysis by tapping into broad market internals to uncover the underlying forces driving the New York session. Whether you’re scalping, day trading, or monitoring short-term trends, this indicator helps you quickly gauge market direction, confirm momentum, and identify potential shifts—all from a single, visually accessible table. Its simplicity and focus on real-time data make it a valuable tool for traders seeking clarity in fast-moving markets.
How It Works
The indicator fetches live data from six vital market internals using a 1-second timeframe:
NYSE Advance/Decline (A/D) - Tracks the net balance of advancing versus declining NYSE stocks.
Nasdaq Advance/Decline (A/D) - Monitors the same for Nasdaq stocks.
NYSE VOLD - Measures the net volume difference between buying and selling on the NYSE.
Nasdaq VOLD - Captures the equivalent for Nasdaq.
NYSE TICK - Reflects the net number of NYSE stocks ticking up versus down.
Nasdaq TICK - Provides the same for Nasdaq.
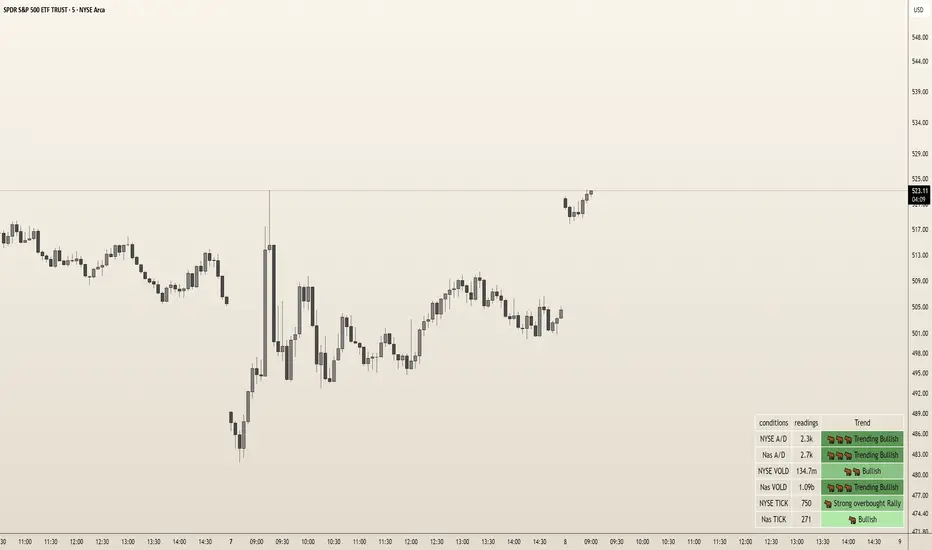
These internals are processed to determine their trend states—such as bullish, bearish, or neutral—displayed in colors and emojis for instant recognition. The table organizes this data into three columns: the condition (e.g., "NYSE A/D"), its current reading (formatted for readability, like "1.2m" or "500k"), and its trend state (e.g., "Trending Bullish" or "Neutral"). This setup offers a snapshot of market health without overwhelming the user with excessive details.
Internal Signals and Their Role
Each internal signal contributes to understanding the market’s current state and the conditions you’re trading into:
NYSE and Nasdaq A/D: Reveals market breadth. Strong positive values suggest widespread buying, while negative readings indicate broad selling, helping you confirm if a move has robust participation.
NYSE and Nasdaq VOLD: Tracks volume momentum. High positive figures point to aggressive buying pressure, while deep negatives signal heavy selling, validating whether price moves are backed by volume.
NYSE and Nasdaq TICK: Captures short-term sentiment. Extreme readings highlight overbought or oversold conditions, offering clues about momentum strength or potential exhaustion.
How Signals Confirm Conditions
Trend States: Each internal’s trend state (e.g., "Bullish," "Bearish," "Trending Bearish") reflects its current momentum. Consistent bullish states across multiple internals confirm a strong upward trend, while bearish alignments suggest selling pressure. Neutral or mixed states indicate indecision or choppiness, guiding you to adjust expectations accordingly.
Visual Cues: Color-coded backgrounds (e.g., green for bullish, red for bearish) and emojis (e.g., 🐂for bullish, 🐻for bearish) make it easy to spot dominant conditions or emerging shifts, enhancing your ability to react quickly.
How to Use It
Add to Chart: Apply the indicator to any symbol (Best W/ SPY, QQQ, IWM and correlated futures securities) on a 1-second or higher timeframe. The table appears in your chosen position (default: bottom right).
Monitor Internals: Check the table for real-time readings and trend states. For example, "NYSE TICK: 800, Strong Overbought Rally" signals short-term bullish momentum.
Assess Conditions: Look for alignment across internals—e.g., multiple "Bullish" states suggest buying strength, while "Neutral" dominance warns of choppy action.
Adapt Your Strategy: Use the trend states to confirm entries, exits, or hold-off decisions. Pair with price tools (e.g., candlestick patterns) for a fuller picture.
Customize: Adjust table position, orientation (vertical/horizontal), text size, colors, and transparency via inputs to match your setup.
Customization
Tailor the experience with options for table placement (e.g., "Top Left"), text size (e.g., "Small" to "Huge"), orientation, and color schemes. Adjust transparency settings to keep the table unobtrusive yet readable.
Limitations
- Requires real-time NYSE/Nasdaq data access, which may depend on your TradingView subscription.
- Displays current conditions only, not predictive signals—use it as a real-time snapshot, not a crystal ball.
- Best paired with price analysis for comprehensive trading decisions.
- Requires a TradingView Subscription that supports the 1s Time Frame
Why It’s Original
The Dolores Trading Assistant stands out with its elegant, yet simple table-based presentation of NYSE and Nasdaq internals, distilled into an intuitive format with trend states and visual cues. Unlike cluttered dashboards or generic mashups, it offers a focused, trader-centric view of market momentum, avoiding unnecessary complexity while delivering actionable insights—making it a fresh and practical tool for the New York session.
Skrip jemputan sahaja
Hanya pengguna disahkan oleh penulis boleh mengakses skrip ini. Anda perlu memohon dan mendapatkan kebenaran untuk menggunakannya. Keizinan selalunya diberikan selepas pembayaran. Untuk lebih butiran, ikuti arahan penulis di bawah atau hubungi ATMTrades secara terus.
TradingView TIDAK menyarankan pembayaran atau penggunaan skrip kecuali anda mempercayai sepenuhnya penulis dan memahami bagaimana ia berfungsi. Anda juga boleh menjumpai alternatif sumber terbuka dan percuma yang lain di dalam skrip komuniti kami.
Arahan penulis
Penafian
Skrip jemputan sahaja
Hanya pengguna disahkan oleh penulis boleh mengakses skrip ini. Anda perlu memohon dan mendapatkan kebenaran untuk menggunakannya. Keizinan selalunya diberikan selepas pembayaran. Untuk lebih butiran, ikuti arahan penulis di bawah atau hubungi ATMTrades secara terus.
TradingView TIDAK menyarankan pembayaran atau penggunaan skrip kecuali anda mempercayai sepenuhnya penulis dan memahami bagaimana ia berfungsi. Anda juga boleh menjumpai alternatif sumber terbuka dan percuma yang lain di dalam skrip komuniti kami.