OPEN-SOURCE SCRIPT
Spectral Order Flow Resonance (SOFR)
Spectral Order Flow Resonance (SOFR)
See the Market’s Hidden Rhythms—Trade the Resonance, Not the Noise!
The Spectral Order Flow Resonance (SOFR) is a next-generation tool for traders who want to go beyond price and volume, tapping into the underlying “frequency signature” of order flow itself. Instead of chasing lagging signals or reacting to surface-level volatility, SOFR lets you visualize and quantify the real-time resonance of market activity—helping you spot when the crowd is in sync, and when the regime is about to shift.
What Makes SOFR Unique?
Not Just Another Oscillator:
SOFR doesn’t just measure momentum or volume. It applies spectral analysis (using Fast Fourier Transform) to normalized order flow, extracting the dominant cycles and their resonance strength. This reveals when the market is harmonizing around key frequencies—often the precursor to major moves.
Regime Detection, Not Guesswork:
By tracking harmonic alignment and phase coherence across multiple Fibonacci-based frequencies, SOFR identifies when the market is entering a bullish, bearish, or neutral resonance regime. This is visualized with a dynamic dashboard and info line, so you always know the current state at a glance.
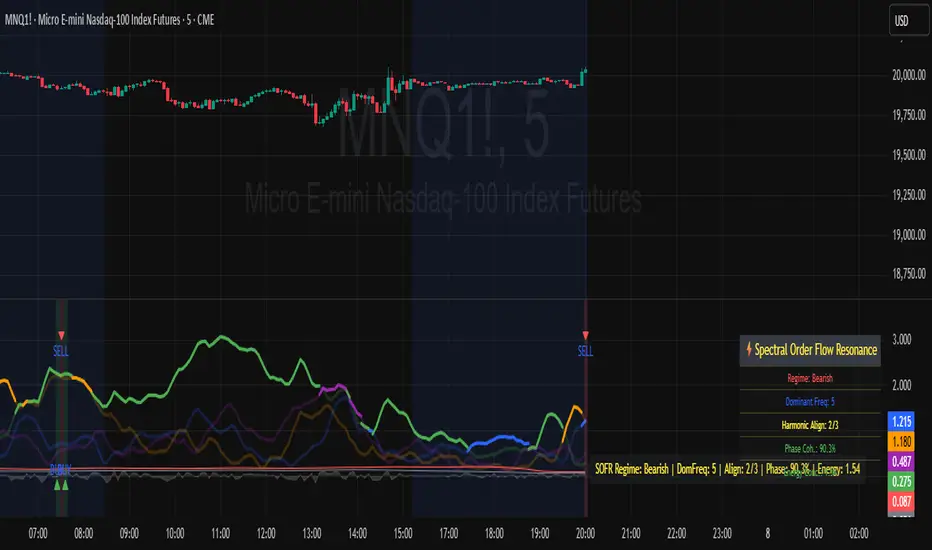
Dynamic Dashboard:
The on-chart dashboard color-codes each key metric—regime, dominant frequency, harmonic alignment, phase coherence, and energy concentration—so you can instantly gauge the strength and direction of the current resonance. No more guesswork or clutter.
Universal Application:
Works on any asset, any timeframe, and in any market—futures, stocks, crypto, forex. If there’s order flow, SOFR can reveal its hidden structure.
How Does It Work?
Order Flow Normalization:
SOFR calculates the net buying/selling pressure and normalizes it using a rolling mean and standard deviation, making the signal robust across assets and timeframes.
Spectral Analysis:
The script applies FFT to the normalized order flow, extracting the magnitude and phase of several key frequencies (typically Fibonacci numbers). This allows you to see which cycles are currently dominating the market.
Resonance & Regime Logic:
When multiple frequencies align and exceed a dynamic resonance threshold, and phase coherence is high, SOFR detects a “resonance regime”—bullish, bearish, or neutral. This is when the market is most likely to experience a strong, sustained move.
Visual Clarity:
The indicator plots each frequency’s magnitude, highlights the dominant one, and provides a real-time dashboard with color-coded metrics for instant decision-making.
SOFR Dashboard Metrics Explained
Regime:
What it means: The current “state” of the market as detected by SOFR—Bullish, Bearish, or Neutral.
Why it matters: The regime tells you whether the market’s order flow is resonating in a way that favors upward moves (Bullish), downward moves (Bearish), or is out of sync (Neutral). This helps you align your trades with the prevailing market force, or stand aside when there’s no clear edge.
Dominant Freq:
What it means: The most powerful frequency (cycle length, in bars) currently detected in the order flow.
Why it matters: Markets often move in cycles. The dominant frequency shows which cycle is currently driving price action, helping you time entries and exits with the market’s “heartbeat.”
Harmonic Align:
What it means: The number of key frequencies (out of 3) that are currently in resonance (above threshold).
Why it matters: When multiple frequencies align, it signals that different groups of traders (with different time horizons) are acting in concert. This increases the probability of a strong, sustained move.
Phase Coh.:
What it means: A measure (0–100%) of how “in sync” the phases of the key frequencies are.
Why it matters: High phase coherence means the market’s cycles are reinforcing each other, not cancelling out. This is a classic signature of trending or explosive moves.
Energy Conc.:
What it means: The concentration of spectral energy in the dominant frequency, relative to the average.
Why it matters: High energy concentration means the market’s activity is focused in one cycle, increasing the odds of a decisive move. Low concentration means the market is scattered and less predictable.
How to Use
Bullish Regime:
When the dashboard shows a green regime and high harmonic alignment, the market is in a bullish resonance—look for long opportunities or trend continuations.
Bearish Regime:
When the regime is red and alignment is high, the market is in a bearish resonance—look for short opportunities or trend continuations.
Neutral Regime:
When the regime is gray or alignment is low, the market is out of sync—consider waiting for clearer signals or using other tools.
Combine with Your Strategy:
Use SOFR as a confirmation tool, a filter for trend/range conditions, or as a standalone regime detector. The dashboard’s color-coded metrics help you instantly spot when the market is entering or exiting resonance.
Inputs Explained
FFT Window Length:
Controls the number of bars used for spectral analysis. Higher values smooth the signal, lower values make it more sensitive.
Order Flow Period:
Sets the lookback for normalizing order flow. Shorter periods react faster, longer periods are smoother.
Fibonacci Frequencies:
Choose which cycles to analyze. Default values (5, 8, 13) capture common market rhythms.
Resonance Threshold:
Sets how strong a frequency’s signal must be to count as “in resonance.” Lower for more signals, higher for stricter filtering.
Signal Smoothing & Amplify:
Fine-tune the display for your chart and asset.
Dashboard & Info Line Toggles:
Show or hide the on-chart dashboard and info line as needed.
Why This Matters
Most indicators show you what just happened. SOFR shows you when the market is entering a state of resonance—when crowd behavior is most likely to produce powerful, sustained moves. By visualizing the hidden structure of order flow, you gain a tactical edge over traders who only see the surface.
For educational purposes only. Not financial advice. Always use proper risk management.
Use with discipline. Trade your edge.
— Dskyz, for DAFE Trading Systems
See the Market’s Hidden Rhythms—Trade the Resonance, Not the Noise!
The Spectral Order Flow Resonance (SOFR) is a next-generation tool for traders who want to go beyond price and volume, tapping into the underlying “frequency signature” of order flow itself. Instead of chasing lagging signals or reacting to surface-level volatility, SOFR lets you visualize and quantify the real-time resonance of market activity—helping you spot when the crowd is in sync, and when the regime is about to shift.
What Makes SOFR Unique?
Not Just Another Oscillator:
SOFR doesn’t just measure momentum or volume. It applies spectral analysis (using Fast Fourier Transform) to normalized order flow, extracting the dominant cycles and their resonance strength. This reveals when the market is harmonizing around key frequencies—often the precursor to major moves.
Regime Detection, Not Guesswork:
By tracking harmonic alignment and phase coherence across multiple Fibonacci-based frequencies, SOFR identifies when the market is entering a bullish, bearish, or neutral resonance regime. This is visualized with a dynamic dashboard and info line, so you always know the current state at a glance.
Dynamic Dashboard:
The on-chart dashboard color-codes each key metric—regime, dominant frequency, harmonic alignment, phase coherence, and energy concentration—so you can instantly gauge the strength and direction of the current resonance. No more guesswork or clutter.
Universal Application:
Works on any asset, any timeframe, and in any market—futures, stocks, crypto, forex. If there’s order flow, SOFR can reveal its hidden structure.
How Does It Work?
Order Flow Normalization:
SOFR calculates the net buying/selling pressure and normalizes it using a rolling mean and standard deviation, making the signal robust across assets and timeframes.
Spectral Analysis:
The script applies FFT to the normalized order flow, extracting the magnitude and phase of several key frequencies (typically Fibonacci numbers). This allows you to see which cycles are currently dominating the market.
Resonance & Regime Logic:
When multiple frequencies align and exceed a dynamic resonance threshold, and phase coherence is high, SOFR detects a “resonance regime”—bullish, bearish, or neutral. This is when the market is most likely to experience a strong, sustained move.
Visual Clarity:
The indicator plots each frequency’s magnitude, highlights the dominant one, and provides a real-time dashboard with color-coded metrics for instant decision-making.
SOFR Dashboard Metrics Explained
Regime:
What it means: The current “state” of the market as detected by SOFR—Bullish, Bearish, or Neutral.
Why it matters: The regime tells you whether the market’s order flow is resonating in a way that favors upward moves (Bullish), downward moves (Bearish), or is out of sync (Neutral). This helps you align your trades with the prevailing market force, or stand aside when there’s no clear edge.
Dominant Freq:
What it means: The most powerful frequency (cycle length, in bars) currently detected in the order flow.
Why it matters: Markets often move in cycles. The dominant frequency shows which cycle is currently driving price action, helping you time entries and exits with the market’s “heartbeat.”
Harmonic Align:
What it means: The number of key frequencies (out of 3) that are currently in resonance (above threshold).
Why it matters: When multiple frequencies align, it signals that different groups of traders (with different time horizons) are acting in concert. This increases the probability of a strong, sustained move.
Phase Coh.:
What it means: A measure (0–100%) of how “in sync” the phases of the key frequencies are.
Why it matters: High phase coherence means the market’s cycles are reinforcing each other, not cancelling out. This is a classic signature of trending or explosive moves.
Energy Conc.:
What it means: The concentration of spectral energy in the dominant frequency, relative to the average.
Why it matters: High energy concentration means the market’s activity is focused in one cycle, increasing the odds of a decisive move. Low concentration means the market is scattered and less predictable.
How to Use
Bullish Regime:
When the dashboard shows a green regime and high harmonic alignment, the market is in a bullish resonance—look for long opportunities or trend continuations.
Bearish Regime:
When the regime is red and alignment is high, the market is in a bearish resonance—look for short opportunities or trend continuations.
Neutral Regime:
When the regime is gray or alignment is low, the market is out of sync—consider waiting for clearer signals or using other tools.
Combine with Your Strategy:
Use SOFR as a confirmation tool, a filter for trend/range conditions, or as a standalone regime detector. The dashboard’s color-coded metrics help you instantly spot when the market is entering or exiting resonance.
Inputs Explained
FFT Window Length:
Controls the number of bars used for spectral analysis. Higher values smooth the signal, lower values make it more sensitive.
Order Flow Period:
Sets the lookback for normalizing order flow. Shorter periods react faster, longer periods are smoother.
Fibonacci Frequencies:
Choose which cycles to analyze. Default values (5, 8, 13) capture common market rhythms.
Resonance Threshold:
Sets how strong a frequency’s signal must be to count as “in resonance.” Lower for more signals, higher for stricter filtering.
Signal Smoothing & Amplify:
Fine-tune the display for your chart and asset.
Dashboard & Info Line Toggles:
Show or hide the on-chart dashboard and info line as needed.
Why This Matters
Most indicators show you what just happened. SOFR shows you when the market is entering a state of resonance—when crowd behavior is most likely to produce powerful, sustained moves. By visualizing the hidden structure of order flow, you gain a tactical edge over traders who only see the surface.
For educational purposes only. Not financial advice. Always use proper risk management.
Use with discipline. Trade your edge.
— Dskyz, for DAFE Trading Systems
Skrip sumber terbuka
Dalam semangat TradingView sebenar, pencipta skrip ini telah menjadikannya sumber terbuka, jadi pedagang boleh menilai dan mengesahkan kefungsiannya. Terima kasih kepada penulis! Walaupuan anda boleh menggunakan secara percuma, ingat bahawa penerbitan semula kod ini tertakluk kepada Peraturan Dalaman.
Empowering everyday traders and DAFE Trading Systems
DAFETradingSystems.com
DAFETradingSystems.com
Penafian
Maklumat dan penerbitan adalah tidak bertujuan, dan tidak membentuk, nasihat atau cadangan kewangan, pelaburan, dagangan atau jenis lain yang diberikan atau disahkan oleh TradingView. Baca lebih dalam Terma Penggunaan.