OPEN-SOURCE SCRIPT
Linear Regression Slope - Version 2
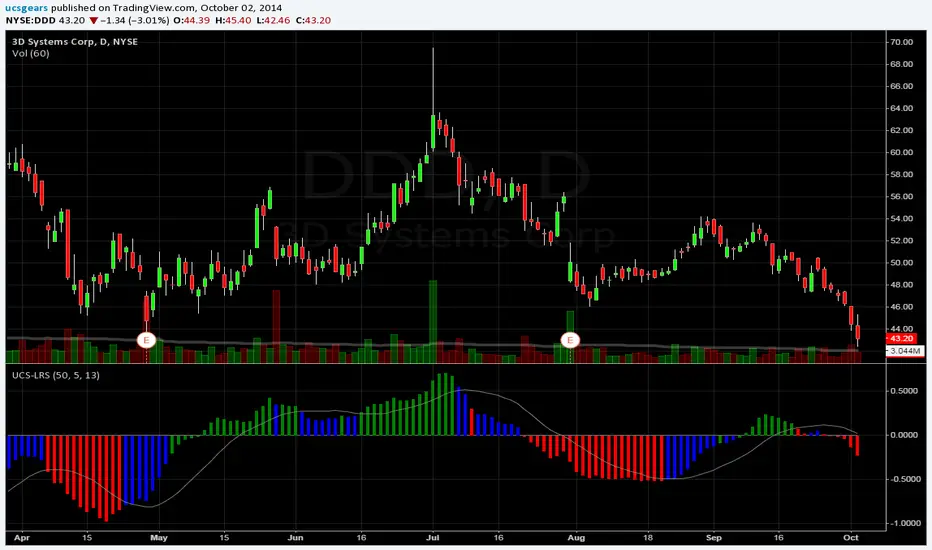
Version 2 - Linear Regression Slope. This version will have more freedom on picking your own length for all the Inputs.
One of the main reason I changed it is because, Slope calculation on transition period was not being computed properly. Because the Version 1, looks back the length assigned, and compute the slope based on two candle readings, could be 10 days apart or 50. That was misleading.
Therefore, I changed it to plot daily slope and Smooth it with an EMA.
Linear Regression Curve - tradingview.com/v/JojPxTRD/
List of All my Indicators - tradingview.com/p/stocks/?sort=recent&time=day&by=ucsgears
Skrip sumber terbuka
Dalam semangat sebenar TradingView, pencipta skrip ini telah menjadikannya sumber terbuka supaya pedagang dapat menilai dan mengesahkan kefungsiannya. Terima kasih kepada penulis! Walaupun anda boleh menggunakannya secara percuma, ingat bahawa menerbitkan semula kod ini adalah tertakluk kepada Peraturan Dalaman kami.
Uday C Santhakumar
Penafian
Maklumat dan penerbitan adalah tidak dimaksudkan untuk menjadi, dan tidak membentuk, nasihat untuk kewangan, pelaburan, perdagangan dan jenis-jenis lain atau cadangan yang dibekalkan atau disahkan oleh TradingView. Baca dengan lebih lanjut di Terma Penggunaan.