PROTECTED SOURCE SCRIPT
Nadaraya-Watson Envelope & RSI & Stoch RSI - Step 2
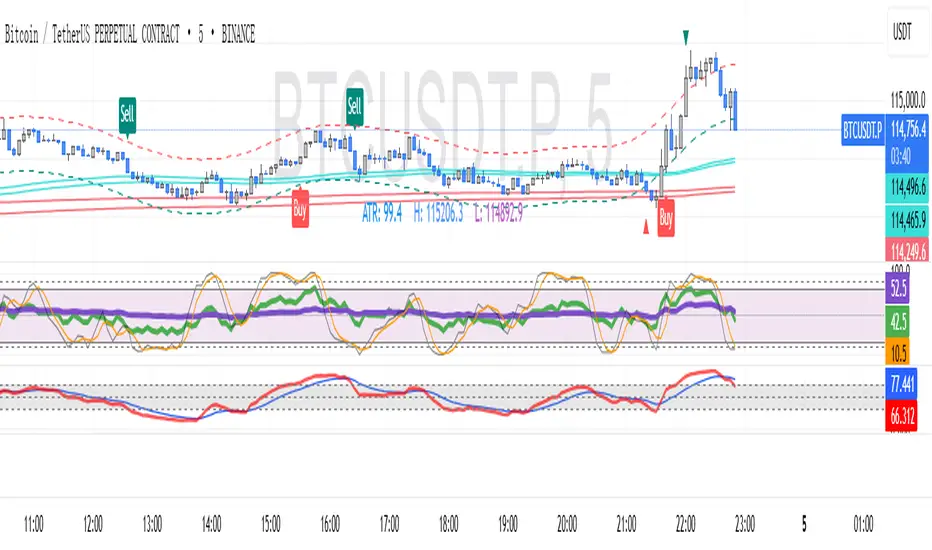
A compact and effective momentum confirmation tool designed to validate price-based entries using dual RSI and smoothed Stochastic RSI structures.
🧠 Why Combine RSI and StochRSI?
This script blends two levels of RSI analysis to help traders assess overbought/oversold conditions and detect early reversal signals:
The dual RSI structure provides a fast-vs-slow momentum comparison, offering both short-term timing and longer-term trend sensitivity.
The StochRSI module helps confirm reversal setups with smoother K/D crossovers.
Background zone shading enhances visibility of exhaustion areas.
These combined tools serve as a secondary validation layer, perfect for scalpers and swing traders using price-based strategies.
🔍 Feature Modules
🟢 Dual RSI
Fast and slow RSI lines plotted together for comparative strength tracking.
Shaded zone between typical exhaustion levels (e.g., 30~70) to highlight potential mean reversions.
🟠 Stochastic RSI
Uses smoothed K & D lines based on a short RSI input.
Visual aids include:
Extreme zones (e.g., 30 / 70)
Midline for trend bias (50)
Transparent fills to highlight oversold/overbought cross events.
⚙️ Suggested Use Cases
Use RSI divergence or alignment to confirm entries from your main price action strategy.
Monitor K/D crossover signals to fine-tune entry or exit timing.
Filter fakeouts by requiring agreement across all three signals (Fast RSI, Slow RSI, and StochRSI).
✅ Originality Statement
This script isn't just a visual mashup of indicators—it carefully integrates multiple layers of RSI logic to build confidence for timing trades in volatile or ranging markets.
⚠️ Disclaimer
This tool is for research and educational purposes only. It is not financial advice. Trading involves risk. Use at your own discretion.
Skrip dilindungi
Skrip ini diterbitkan sebagai sumber tertutup. Akan tetapi, anda boleh menggunakannya secara bebas dan tanpa apa-apa had – ketahui lebih di sini.
新用戶用以下連結註冊可享 $15 優惠
tw.tradingview.com/black-friday/?share_your_love=jia1109
tw.tradingview.com/black-friday/?share_your_love=jia1109
Penafian
Maklumat dan penerbitan adalah tidak bertujuan, dan tidak membentuk, nasihat atau cadangan kewangan, pelaburan, dagangan atau jenis lain yang diberikan atau disahkan oleh TradingView. Baca lebih dalam Terma Penggunaan.