vdubus

VDUB_RejectionSpike_v1

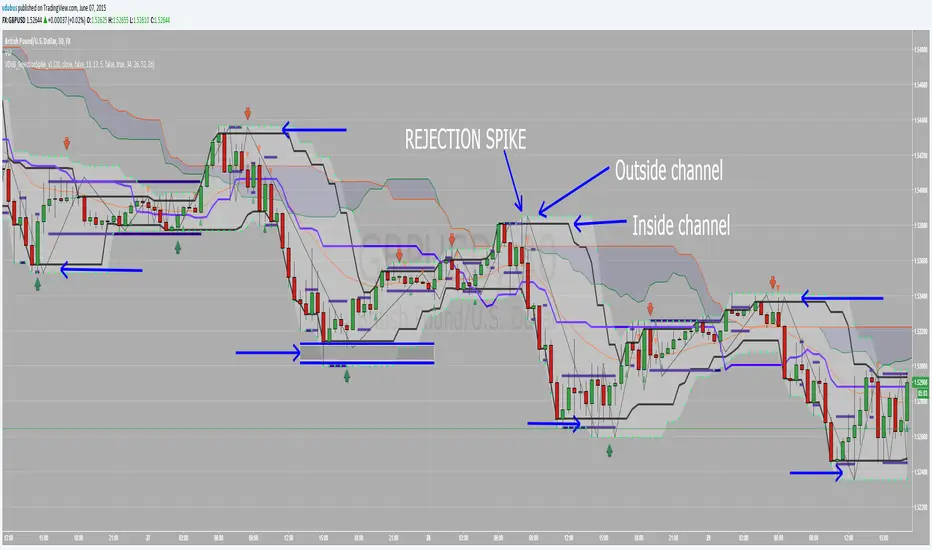
this indicator is for use with the Rejection Spike Strategy I recently publish
Have't had chance to test it yet so feel free to try.
Details of the strategy are listed in the link below

Skrip sumber terbuka

Dalam semangat TradingView yang sebenar, penulis skrip ini telah menerbitkannya dengan menggunakan sumber terbuka supaya pedagang-pedagang dapat memahami dan mengesahkannya. Sorakan kepada penulis! Anda dapat menggunakannya secara percuma tetapi penggunaan semula kod ini dalam penerbitan adalah dikawalselia oleh Peraturan Dalaman. Anda boleh menyukainya untuk menggunakannya pada carta.

Penafian

Maklumat dan penerbitan adalah tidak dimaksudkan untuk menjadi, dan tidak membentuk, nasihat untuk kewangan, pelaburan, perdagangan dan jenis-jenis lain atau cadangan yang dibekalkan atau disahkan oleh TradingView. Baca dengan lebih lanjut di Terma Penggunaan.

Ingin menggunakan skrip ini pada carta?
study(title="VDUB_RejectionSpike_v1", shorttitle="VDUB_RejectionSpike_v1", overlay=true)
//==============================inside channel===============================================//
len = input(20, minval=1, title="Length")
src = input(close, title="Source")
out = ema(src, len)
plot(out, title="EMA", color=red)
last8h = highest(close,13)
lastl8 = lowest(close, 13)

plot(last8h, color=black,style=line, linewidth=3)
plot(lastl8, color=black,style=line, linewidth=3)

bearish = cross(close,out) == 1 and close[1] > close 
bullish = cross(close,out) == 1 and close[1] < close 

plotshape(bearish, color=red, style=shape.triangledown, text="", location=location.abovebar)
plotshape(bullish, color=green, style=shape.triangleup, text="", location=location.belowbar)
//-------------LB Range---------------------------
channel=input(false, title="channel")
up = close<nz(up[1]) and close>down[1] ? nz(up[1]) : high
down = close<nz(up[1]) and close>down[1] ? nz(down[1]) : low
ul=plot(channel?up:up==nz(up[1])?up:na, color=navy, linewidth=4, style=linebr, title="Up")
ll=plot(channel?down:down==nz(down[1])?down:na, color=navy, linewidth=4, style=linebr, title="Down")
//==============================Outside channel===============================================//
length1 = input(13, minval=1, title="Upper Channel")
length2 = input(13, minval=1, title="Lower Channel")

upper = highest(length1)
lower = lowest(length2)

basis = avg(upper, lower)

l = plot(lower, style=circles, linewidth=2, color=lime)
u = plot(upper, style=circles, linewidth=2, color=lime)

fill(u, l, color=white, transp=75, title="Fill")
//============================zigzag======//
length = input(5)
showBasis = input(false)
hls = ema(hl2, length)

plot(not showBasis ? na : hls, color=black)
isRising = hls >= hls[1]

zigzag = isRising and not isRising[1] ? lowest(length) :  not isRising and isRising[1] ? highest(length) : na
plot(zigzag, color=black)
//============================Ichomku cloud
show_cloud = input(true, title="Display Ichimoku Cloud:")
conversionPeriods = input(34, minval=1)
basePeriods = input(26, minval=1)
laggingSpan2Periods = input(52, minval=1)
displacement = input(26, minval=1)

donchian(len) => avg(lowest(len), highest(len))

conversionLine = donchian(conversionPeriods)
baseLine = donchian(basePeriods)
leadLine1 = avg(conversionLine, baseLine)
leadLine2 = donchian(laggingSpan2Periods)

plot(not show_cloud ? na : conversionLine, color=blue,linewidth=3, style=line, title="Mid line resistance levels")
//plot(baseLine, color=red, title="Base Line")
//plot(close, offset = -displacement, color=green, title="Lagging Span")

p1 = plot(not show_cloud ? na : leadLine1, offset = displacement, color=green, title="Lead 1")
p2 = plot(not show_cloud ? na : leadLine2, offset = displacement, color=red, title="Lead 2")
fill(p1, p2)
//-------------------------------------------------------------