OPEN-SOURCE SCRIPT
3B + Killzones Strategy
📘 3B + Killzones Strategy (no ATR, no presets) — Triangles = Trades
Author: © OutOfOptions — Simplified & adapted by ChatGPT
Version: Pine Script® v6
Category: Liquidity, SMT (Smart Money Technique), Killzones, Automated Entries
🧩 Overview
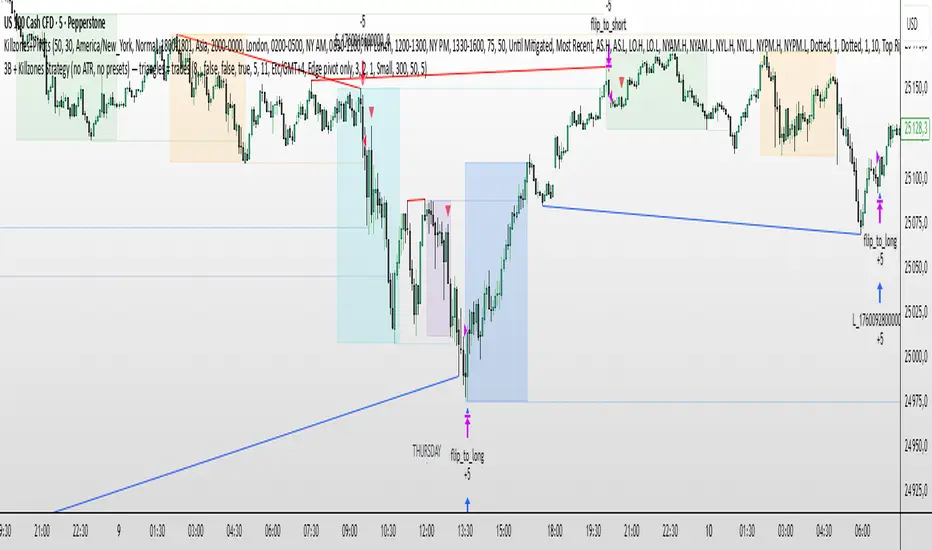
The 3B + Killzones Strategy is a Smart Money–inspired trading framework that automatically detects SMT divergences, validates them within selected Killzones, and confirms entries using Engulfing patterns (represented as triangles on the chart).
Each displayed triangle represents a valid trade signal — the strategy executes simulated entries, manages risk, and places take-profit and stop-loss orders automatically.
This version is fully self-contained (no ATR, no presets), optimized for clarity, visual precision, and real-time use.
⚙️ Core Features
Automatic SMT detection (NQ↔ES or custom pair)
The script auto-pairs tickers (e.g., ES with NQ) to detect Smart Money divergence (SMT).
You can also manually specify the comparison symbol.
Killzones Filtering
Trades and SMTs can be restricted to specific market sessions:
London: 02:00–05:00 NY
NY AM: 08:30–11:00
NY Lunch: 12:00–13:00
NY PM: 13:30–16:00
Asia: 20:00–00:00 (updated session time)
Each Killzone can be toggled independently.
VWAP Filter (optional)
You can validate SMTs only if price is above/below VWAP depending on bias.
Engulfing Confirmation
Only strong-body engulfing candles within a configurable bar window after SMT are considered valid trade triggers.
Each engulfing pattern displays a triangle — blue (bullish) or red (bearish).
Automatic Trade Execution (Backtest Mode)
Every displayed triangle = an executed strategy order:
Dynamic position sizing based on % risk per trade
Configurable minimum SL distance and max contract size
2:1 RR (Reward-to-Risk) by default
Auto-flip option (reverse on opposite signal)
Visual Stop-Loss Display (optional)
When enabled, the exact SL price of each executed position is drawn on the chart as a dotted horizontal line with a small label.
This doesn’t affect logic — purely visual.
🧠 Logic Summary
Detect SMT divergence between two correlated instruments.
Validate divergence inside chosen Killzones (optional).
Wait for an engulfing candle confirmation within the defined window (engWindowBars).
Display a triangle (bullish or bearish).
If strategy trading is enabled, execute a simulated order with TP/SL automatically managed.
🎨 Visuals
Colored lines = SMT divergences (blue for bullish, red for bearish)
Triangles = Engulfing confirmations (and actual trade triggers)
Optional VWAP plot
Optional horizontal Stop-Loss lines with labels
📊 Backtesting Parameters
Parameter Description Default
risk_pct % of equity risked per trade 0.5%
rr Reward-to-Risk ratio 2:1
min_sl_points Minimum SL distance 50 points
max_qty Maximum position size 5
calc_on_every_tick Real-time tick calculation ✅
Author: © OutOfOptions — Simplified & adapted by ChatGPT
Version: Pine Script® v6
Category: Liquidity, SMT (Smart Money Technique), Killzones, Automated Entries
🧩 Overview
The 3B + Killzones Strategy is a Smart Money–inspired trading framework that automatically detects SMT divergences, validates them within selected Killzones, and confirms entries using Engulfing patterns (represented as triangles on the chart).
Each displayed triangle represents a valid trade signal — the strategy executes simulated entries, manages risk, and places take-profit and stop-loss orders automatically.
This version is fully self-contained (no ATR, no presets), optimized for clarity, visual precision, and real-time use.
⚙️ Core Features
Automatic SMT detection (NQ↔ES or custom pair)
The script auto-pairs tickers (e.g., ES with NQ) to detect Smart Money divergence (SMT).
You can also manually specify the comparison symbol.
Killzones Filtering
Trades and SMTs can be restricted to specific market sessions:
London: 02:00–05:00 NY
NY AM: 08:30–11:00
NY Lunch: 12:00–13:00
NY PM: 13:30–16:00
Asia: 20:00–00:00 (updated session time)
Each Killzone can be toggled independently.
VWAP Filter (optional)
You can validate SMTs only if price is above/below VWAP depending on bias.
Engulfing Confirmation
Only strong-body engulfing candles within a configurable bar window after SMT are considered valid trade triggers.
Each engulfing pattern displays a triangle — blue (bullish) or red (bearish).
Automatic Trade Execution (Backtest Mode)
Every displayed triangle = an executed strategy order:
Dynamic position sizing based on % risk per trade
Configurable minimum SL distance and max contract size
2:1 RR (Reward-to-Risk) by default
Auto-flip option (reverse on opposite signal)
Visual Stop-Loss Display (optional)
When enabled, the exact SL price of each executed position is drawn on the chart as a dotted horizontal line with a small label.
This doesn’t affect logic — purely visual.
🧠 Logic Summary
Detect SMT divergence between two correlated instruments.
Validate divergence inside chosen Killzones (optional).
Wait for an engulfing candle confirmation within the defined window (engWindowBars).
Display a triangle (bullish or bearish).
If strategy trading is enabled, execute a simulated order with TP/SL automatically managed.
🎨 Visuals
Colored lines = SMT divergences (blue for bullish, red for bearish)
Triangles = Engulfing confirmations (and actual trade triggers)
Optional VWAP plot
Optional horizontal Stop-Loss lines with labels
📊 Backtesting Parameters
Parameter Description Default
risk_pct % of equity risked per trade 0.5%
rr Reward-to-Risk ratio 2:1
min_sl_points Minimum SL distance 50 points
max_qty Maximum position size 5
calc_on_every_tick Real-time tick calculation ✅
Skrip sumber terbuka
Dalam semangat sebenar TradingView, pencipta skrip ini telah menjadikannya sumber terbuka supaya pedagang dapat menilai dan mengesahkan kefungsiannya. Terima kasih kepada penulis! Walaupun anda boleh menggunakannya secara percuma, ingat bahawa menerbitkan semula kod ini adalah tertakluk kepada Peraturan Dalaman kami.
Penafian
Maklumat dan penerbitan adalah tidak dimaksudkan untuk menjadi, dan tidak membentuk, nasihat untuk kewangan, pelaburan, perdagangan dan jenis-jenis lain atau cadangan yang dibekalkan atau disahkan oleh TradingView. Baca dengan lebih lanjut di Terma Penggunaan.