OPEN-SOURCE SCRIPT
Telah dikemas kini Ord Volume [LucF]
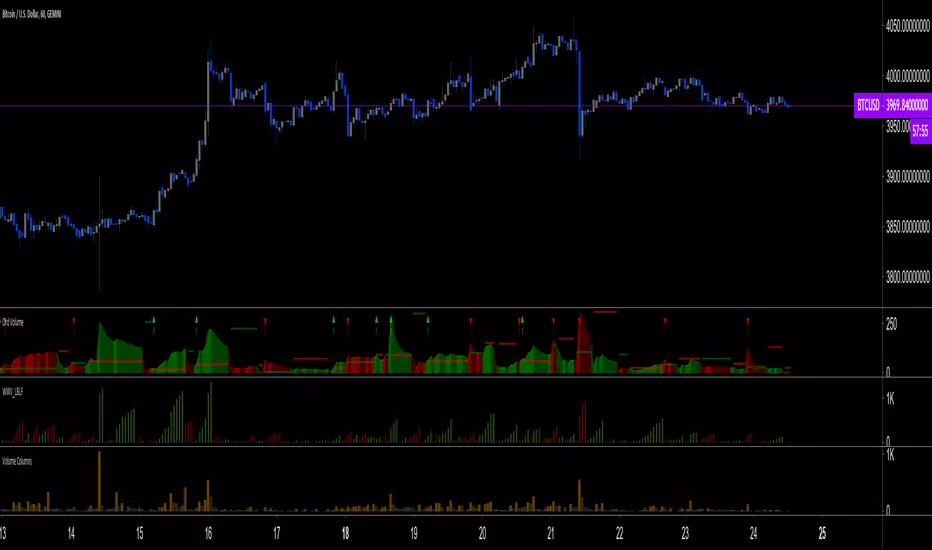
Tim Ord came up with the Ord Volume concept. The idea is similar to Weis Wave, except that where Weis Wave keeps a cumulative tab of each wave’s successive volume columns, Ord Volume tracks the wave's average volume.
Features
Use Cases
Note
Being dependent on volume information as it is currently available in Pine, which does not include a practical way to retrieve delta volume information, the indicator suffers the same lack of precision as most other Pine-built volume indicators. For those not aware of the issue, the problem is that there is no way to distinguish the buying and selling volume (delta volume) in a bar, other than by looping through inside intervals using the security() function, which for me makes performance unsustainable in day to day use, while only providing an approximation of delta volume.
Features
- You can choose to distinguish the area’s colors when the average is rising/falling (default).
- You can show an EMA of the wave averages, which is different than an EMA on raw volume.
- You can show (default) the last wave’s ending average over the current wave, to help in comparing relative levels.
- You can change the length of the trend that needs to be broken for a new wave to start, as well as the price used in trend detection.
Use Cases
- As with Weis Wave, what I look at first are three characteristics of the waves: their length, height and slope. I then compare those to the corresponding price movements, looking for discrepancies. For example, consecutive bearish waves of equal strength associated with lesser and lesser price movements are often a good indication of an impeding reversal.
- Because Ord Volume uses average rather than cumulative volume, I find it is often easier to distinguish what is going on during waves, especially exhaustion at the end of waves.
- Tim Ord has a method for entries and exits where he uses Ord Volume in conjunction with tests of support and resistance levels. Here are two articles published in 2004 where Ord explains his technique:
pr.b5z.net/i/u/10144154/f/Ord Articles/PriceVolume.pdfn.b5z.net/i/u/10144154/f/Ord Articles/Stock_and_commodities_July_2006.pdf
Note
Being dependent on volume information as it is currently available in Pine, which does not include a practical way to retrieve delta volume information, the indicator suffers the same lack of precision as most other Pine-built volume indicators. For those not aware of the issue, the problem is that there is no way to distinguish the buying and selling volume (delta volume) in a bar, other than by looping through inside intervals using the security() function, which for me makes performance unsustainable in day to day use, while only providing an approximation of delta volume.
Nota Keluaran
- Added Marker 1 that triggers when the current wave's average volume breaches the previous wave's highest average volume.
- You can show the previous wave's highest average volume.
- You can create an alert on the marker.
Alerts
You can define alerts on any combination of markers you configure. After defining the markers you want the alert to trigger on, make sure you are on the interval you want the alert to be monitoring at, then create the alert, select the indicator's name, use the default “Configured Markers” alert condition and choose your triggering window (usually “Once Per Bar Close”). Once the alert is created, you can change the indicator's inputs with no effect on the alert.
Skrip sumber terbuka
Dalam semangat TradingView sebenar, pencipta skrip ini telah menjadikannya sumber terbuka, jadi pedagang boleh menilai dan mengesahkan kefungsiannya. Terima kasih kepada penulis! Walaupuan anda boleh menggunakan secara percuma, ingat bahawa penerbitan semula kod ini tertakluk kepada Peraturan Dalaman.
"The stock market is a device for transferring money from the impatient to the patient."
— Buffet
tradingview.com/u/PineCoders/
tradingview.com/u/TradingView/
— Buffet
tradingview.com/u/PineCoders/
tradingview.com/u/TradingView/
Penafian
Maklumat dan penerbitan adalah tidak bertujuan, dan tidak membentuk, nasihat atau cadangan kewangan, pelaburan, dagangan atau jenis lain yang diberikan atau disahkan oleh TradingView. Baca lebih dalam Terma Penggunaan.