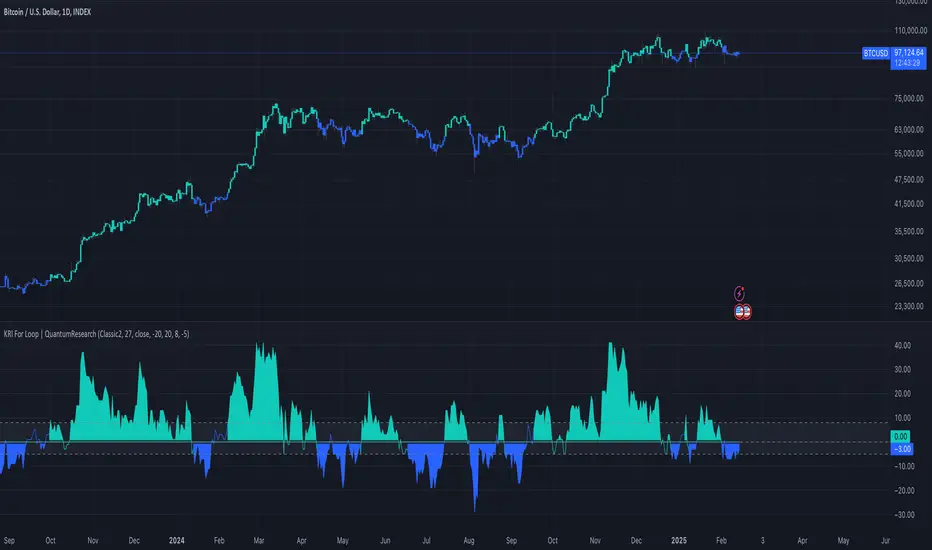
KRI For Loop | QuantumResearch
The KRI For Loop indicator is an advanced trend-following tool that enhances the traditional Kairi Relative Index (KRI) with a for-loop scoring mechanism. The Kairi Relative Index (KRI) measures the percentage deviation of price from its smoothed moving average, helping traders identify market trends and reversals. By incorporating a for-loop calculation, this version refines trend detection, making it a powerful tool for traders seeking precise entry and exit points.
- Understanding the KRI For Loop
The Kairi Relative Index (KRI) is a momentum-based indicator that calculates how far the current price deviates from its moving average, expressed as a percentage. It is widely used to identify overbought and oversold conditions, as well as potential trend reversals.
In this enhanced version, a for-loop scoring mechanism systematically evaluates KRI values within a defined range to determine trend strength:
KRI Calculation: The formula computes the percentage difference between price and an Exponential Moving Average (EMA) of a user-defined length.
For-Loop Scoring: A dynamic scoring system assesses the strength of KRI values across a range (default: -20 to 20), helping to refine market trend analysis. - Threshold-Based Signal Generation:
Long Signal: Triggered when the for-loop score surpasses the long threshold (default: 8).
Short Signal: Triggered when the score falls below the short threshold (default: -5). - Visual Representation
The KRI For Loop indicator provides a clear, color-coded trend analysis:
Green Bars: Indicate bullish conditions when the score surpasses the long threshold, signaling a potential buy opportunity.
Red Bars: Indicate bearish conditions when the score drops below the short threshold, suggesting a sell opportunity.
Gray Bars: Show neutral conditions when the score remains within the defined range.
KRI Bands: Three horizontal bands help visualize market structure:
Upper Band: Represents the bullish threshold.
Middle Band: Zero line for neutral conditions.
Lower Band: Represents the bearish threshold.
Background Fill: A shaded area between the bands highlights trend intensity.
Customization & Parameters - The KRI For Loop indicator offers multiple user-configurable settings for flexibility:
KRI Length: Default set to 27, determines the EMA smoothing period.
Source Price: Selectable input price for calculations (default: close).
Scoring Range (a, b): Defines the range of KRI values assessed in the for-loop (default: -20 to 20). - Long & Short Thresholds:
Long Threshold: Default set to 8, determines when bullish conditions are strong enough for a buy signal.
Short Threshold: Default set to -5, identifies bearish conditions for sell signals. - Color Modes: Choose from eight distinct color schemes to personalize the indicator’s appearance.
- Trading Applications
This indicator is highly adaptable and can be applied to various trading strategies, including:
Momentum Trading: Evaluates trend strength based on KRI deviation and for-loop scoring.
Trend Following: Helps traders stay in profitable trends by identifying strong bullish and bearish conditions.
Reversal Detection: The crossing of key KRI thresholds can signal potential market reversals.
Risk Management: Clearly defined entry and exit rules help traders manage risk effectively. - Final Note
Rocheur’s KRI For Loop indicator combines the power of the Kairi Relative Index (KRI) with an advanced for-loop scoring method to deliver a refined market trend analysis. This structured approach offers traders a dynamic and visually intuitive tool for detecting momentum shifts and trend reversals. As always, backtesting and strategic adjustments are essential to fully optimize this indicator for real-world trading.
Skrip jemputan sahaja
Hanya pengguna disahkan oleh penulis boleh mengakses skrip ini. Anda perlu memohon dan mendapatkan kebenaran untuk menggunakannya. Keizinan selalunya diberikan selepas pembayaran. Untuk lebih butiran, ikuti arahan penulis di bawah atau hubungi QuantumResearch secara terus.
TradingView TIDAK menyarankan pembayaran atau penggunaan skrip kecuali anda mempercayai sepenuhnya penulis dan memahami bagaimana ia berfungsi. Anda juga boleh menjumpai alternatif sumber terbuka dan percuma yang lain di dalam skrip komuniti kami.
Arahan penulis
whop.com/quantum-whop/
⚒️ Get access to our toolbox here for free:
quantumresearchportfolio.carrd.co
All tools and content provided are for informational and educational purposes only.
Penafian
Skrip jemputan sahaja
Hanya pengguna disahkan oleh penulis boleh mengakses skrip ini. Anda perlu memohon dan mendapatkan kebenaran untuk menggunakannya. Keizinan selalunya diberikan selepas pembayaran. Untuk lebih butiran, ikuti arahan penulis di bawah atau hubungi QuantumResearch secara terus.
TradingView TIDAK menyarankan pembayaran atau penggunaan skrip kecuali anda mempercayai sepenuhnya penulis dan memahami bagaimana ia berfungsi. Anda juga boleh menjumpai alternatif sumber terbuka dan percuma yang lain di dalam skrip komuniti kami.
Arahan penulis
whop.com/quantum-whop/
⚒️ Get access to our toolbox here for free:
quantumresearchportfolio.carrd.co
All tools and content provided are for informational and educational purposes only.