OPEN-SOURCE SCRIPT
Telah dikemas kini Show Daily Candles on Intraday Chart
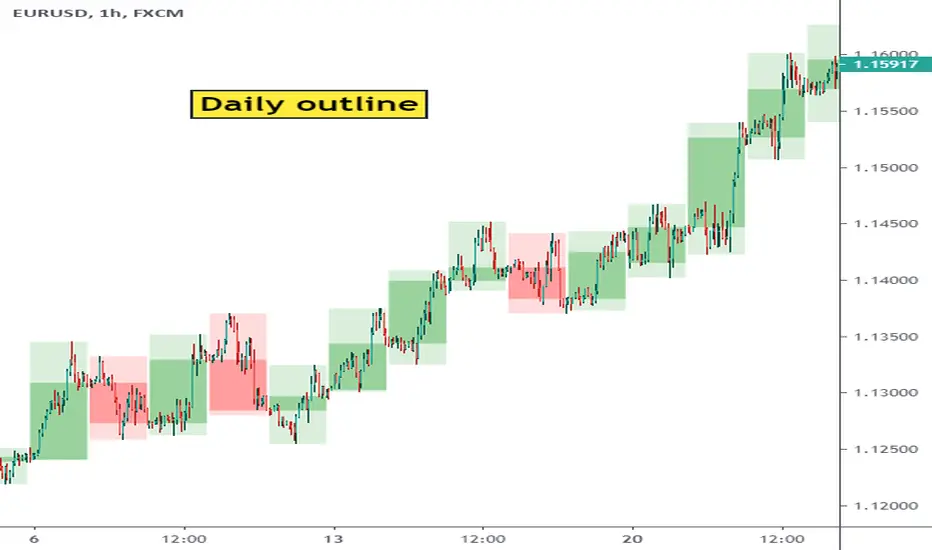
This script shows daily candle outlines on intraday periods. You can use this to simultaneously see what is happening on 'the bigger picture' without changing timeframe.
To address Tradingview moderation comments - this script only shows the outlines of completed days. So the most recent candle outline the indicator will show is yesterday.
I've not used the indicator in live trading yet so I don't know whether its going to be of useful to me yet but it was easy to code so I thought I'd give it a go. (Perhaps it will useful to people on the free tradingview subscription who have limited multi-chart options)
Nota Keluaran
Does not function properly below 10 min periods so i deactivated it if you're on that timeframe. Pinescript does not seem to be able to look back more than 1000 bars so the script can not find where the day starts on the low timeframes...
Nota Keluaran
other update had wrong image...Nota Keluaran
You can now show Weekly and Monthly candles. Use the indicator options tabSkrip sumber terbuka
Dalam semangat TradingView sebenar, pencipta skrip ini telah menjadikannya sumber terbuka, jadi pedagang boleh menilai dan mengesahkan kefungsiannya. Terima kasih kepada penulis! Walaupuan anda boleh menggunakan secara percuma, ingat bahawa penerbitan semula kod ini tertakluk kepada Peraturan Dalaman.
Penafian
Maklumat dan penerbitan adalah tidak bertujuan, dan tidak membentuk, nasihat atau cadangan kewangan, pelaburan, dagangan atau jenis lain yang diberikan atau disahkan oleh TradingView. Baca lebih dalam Terma Penggunaan.
Skrip sumber terbuka
Dalam semangat TradingView sebenar, pencipta skrip ini telah menjadikannya sumber terbuka, jadi pedagang boleh menilai dan mengesahkan kefungsiannya. Terima kasih kepada penulis! Walaupuan anda boleh menggunakan secara percuma, ingat bahawa penerbitan semula kod ini tertakluk kepada Peraturan Dalaman.
Penafian
Maklumat dan penerbitan adalah tidak bertujuan, dan tidak membentuk, nasihat atau cadangan kewangan, pelaburan, dagangan atau jenis lain yang diberikan atau disahkan oleh TradingView. Baca lebih dalam Terma Penggunaan.