OPEN-SOURCE SCRIPT
Telah dikemas kini Correlation Table
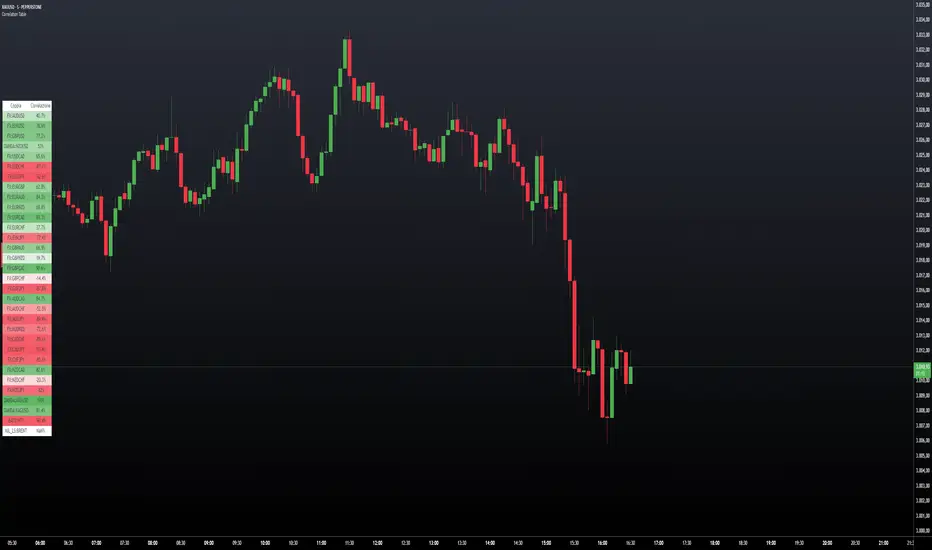
This indicator displays a vertical table that shows the correlation between the asset currently loaded on the chart and up to 32 selected trading pairs. It offers the following features:
Chart-Based Correlation: Correlations are calculated based on the asset you have loaded in your chart, providing relevant insights for your current market focus.
Configurable Pairs: Choose from a list of 32 symbols (e.g., AUDUSD, EURUSD, GBPUSD, etc.) with individual checkboxes to include or exclude each pair in the correlation analysis.
Custom Correlation Length: Adjust the lookback period for the correlation calculation to suit your analysis needs.
Optional EMA Smoothing: Enable an Exponential Moving Average (EMA) on the price data, with a configurable EMA length, to smooth the series before calculating correlations.
Color-Coded Output: The table cells change color based on the correlation strength and direction—neutral, bullish (green), or bearish (red)—making it easy to interpret at a glance.
Clear Table Layout: The indicator outputs a neatly organized vertical table with headers for "Pair" and "Correlation," ensuring the information is displayed cleanly and is easy to understand.
Ideal for traders who want a quick visual overview of how different instruments correlate with their current asset, this tool supports informed multi-asset analysis
ITALIANO:
Questo indicatore visualizza una tabella verticale che mostra la correlazione tra l'asset attualmente caricato sul grafico e fino a 32 coppie di trading selezionate. Offre le seguenti funzionalità:
Correlazione basata sul grafico: le correlazioni vengono calcolate in base all'asset caricato nel grafico, fornendo informazioni pertinenti per il tuo attuale focus di mercato.
Coppie configurabili: scegli da un elenco di 32 simboli (ad esempio, AUDUSD, EURUSD, GBPUSD, ecc.) con caselle di controllo individuali per includere o escludere ciascuna coppia nell'analisi della correlazione.
Lunghezza di correlazione personalizzata: regola il periodo di lookback per il calcolo della correlazione in base alle tue esigenze di analisi.
Smoothing EMA opzionale: abilita una media mobile esponenziale (EMA) sui dati dei prezzi, con una lunghezza EMA configurabile, per smussare la serie prima di calcolare le correlazioni.
Output codificato a colori: le celle della tabella cambiano colore in base alla forza e alla direzione della correlazione, neutra, rialzista (verde) o ribassista (rosso), rendendola facile da interpretare a colpo d'occhio.
Clear Table Layout: l'indicatore genera una tabella verticale ordinatamente organizzata con intestazioni per "Coppia" e "Correlazione", assicurando che le informazioni siano visualizzate in modo chiaro e siano facili da comprendere.
Ideale per i trader che desiderano una rapida panoramica visiva di come diversi strumenti siano correlati con il loro asset corrente, questo strumento supporta un'analisi multi-asset informata
Nota Keluaran
Here is a summary of the improvements made to the correlation indicator:Optimized Default Pairs:
Set 11 major forex pairs as active by default:
-EURUSD
-USDCHF
-USDCAD
-NZDJPY
-AUDJPY
-NZDUSD
-AUDUSD
-GBPJPY
-GBPUSD
-USDJPY
-CADJPY
Other pairs available but disabled by default
Sort System:
Added the ability to sort correlations in:
-Ascending order
-Descending order
-Custom order (default)
-Fixed the ConcurrentModificationException issue in sorting
Improved Documentation:
-Added bilingual tooltip (Italian/English) for the Correlation Length parameter
-Clear explanation of how the correlation calculation works
-Practical example with timeframes (e.g. M5 with 50 periods = 250 minutes)
User Interface:
-Cleaner and more organized layout
-View options customizable for each pair
-Adjustable table size (Large, Medium, Small)
These improvements make the indicator more user-friendly and functional for analyzing correlations between forex pairs.
Nota Keluaran
The main changes are:- Moved array declaration outside the "if" block
- Added "array.clear()" to clear arrays before filling them
- Removed "var" from array declaration inside the block
Nota Keluaran
I made several key changes to make the code more stable, particularly in sorting management. Here are the main modifications:1. **New Sorting Approach**:
sort_pairs(pairs) =>
if sortType != 'Personalizzato'
n = array.size(pairs)
sorted = array.new<PairData>() // Create a new array instead of modifying the existing one
// First copy all values
for i = 0 to n - 1
array.push(sorted, array.get(pairs, i))
- Instead of modifying the original array, we create a new `sorted` array
- first copy all values into this new array
- This prevents modifications to the array while we're reading it
2. **Improved Sorting Algorithm**:
// Selection sort instead of bubble sort
for i = 0 to n - 2
minIdx = i
for j = i + 1 to n - 1
curr = array.get(sorted, minIdx)
next = array.get(sorted, j)
shouldSwap = sortType == 'Crescente' ? curr.correlation > next.correlation : curr.correlation < next.correlation
if shouldSwap
minIdx := j
- implemented selection sort instead of bubble sort
- This algorithm is more stable because it makes fewer swaps
- keep track of the minimum index instead of continuously swapping elements
3. **Safer Swap Management**:
if minIdx != i
temp = array.get(sorted, i)
array.set(sorted, i, array.get(sorted, minIdx))
array.set(sorted, minIdx, temp)
- Swaps are only made when necessary (minIdx != i)
- use a temporary variable for swapping
- This makes the operation safer and prevents data corruption
4. **Clearer Data Flow**:
if barstate.islast
pairs = get_pairs_data() // 1. Get data
sorted_pairs = sort_pairs(pairs) // 2. Sort data safely
update_table(sorted_pairs) // 3. Update table with sorted data
- made the data flow clearer
- Each operation has a specific and well-defined purpose
- The original array remains intact while we work on a sorted copy
These changes have made the code more stable because:
- We avoid concurrent modifications to arrays
- We use a more robust sorting algorithm
- We maintain a clear separation between original and sorted data
- We reduce the risk of data corruption during sorting
Nota Keluaran
Renamed the indicator correctlyNota Keluaran
Summary of Updates1. Replaced Custom Correlation Function with Native Pine Script Function
- The previous custom function was removed.
- Now, the script uses the native and more reliable Pine Script function:
ta.correlation(close, closeX, length)
2. Data Request Simplification
- The `get_close` function now always returns the closing price of the selected symbol:
get_close(symbol) =>
request.security(symbol, timeframe.period, close)
3. Consistent Correlation Calculation
- For each pair, the correlation is now calculated as:
corrX = ta.correlation(close, closeX, length)
---
Result:
The Correlation Table now provides correlation values that are fully aligned with TradingView’s standards and with your Money Flow indicator, improving reliability and comparability.
Italiano:
Riepilogo degli aggiornamenti
1. Funzione di correlazione personalizzata sostituita con la funzione nativa di Pine Script
- La precedente funzione personalizzata è stata rimossa.
- Ora lo script utilizza la funzione nativa e più affidabile di Pine Script:
ta.correlation(close, closeX, length)
2. Semplificazione della richiesta dati
- La funzione `get_close` ora restituisce sempre il prezzo di chiusura del simbolo selezionato:
get_close(symbol) =>
request.security(symbol, timeframe.period, close)
3. Calcolo della correlazione coerente
- Per ogni coppia, la correlazione viene ora calcolata come:
corrX = ta.correlation(close, closeX, length)
---
Risultato:
La tabella di correlazione ora fornisce valori di correlazione completamente allineati con gli standard di TradingView e con l'indicatore Money Flow, migliorando l'affidabilità e la comparabilità.
Nota Keluaran
Added the ability to position the table in different places, such as: in the corners, in the middle, right or leftSkrip sumber terbuka
Dalam semangat TradingView sebenar, pencipta skrip ini telah menjadikannya sumber terbuka, jadi pedagang boleh menilai dan mengesahkan kefungsiannya. Terima kasih kepada penulis! Walaupuan anda boleh menggunakan secara percuma, ingat bahawa penerbitan semula kod ini tertakluk kepada Peraturan Dalaman.
Penafian
Maklumat dan penerbitan adalah tidak bertujuan, dan tidak membentuk, nasihat atau cadangan kewangan, pelaburan, dagangan atau jenis lain yang diberikan atau disahkan oleh TradingView. Baca lebih dalam Terma Penggunaan.
Skrip sumber terbuka
Dalam semangat TradingView sebenar, pencipta skrip ini telah menjadikannya sumber terbuka, jadi pedagang boleh menilai dan mengesahkan kefungsiannya. Terima kasih kepada penulis! Walaupuan anda boleh menggunakan secara percuma, ingat bahawa penerbitan semula kod ini tertakluk kepada Peraturan Dalaman.
Penafian
Maklumat dan penerbitan adalah tidak bertujuan, dan tidak membentuk, nasihat atau cadangan kewangan, pelaburan, dagangan atau jenis lain yang diberikan atau disahkan oleh TradingView. Baca lebih dalam Terma Penggunaan.