OPEN-SOURCE SCRIPT
MACD MultiTimeFrame 1h4h1D [Fantastic Fox]
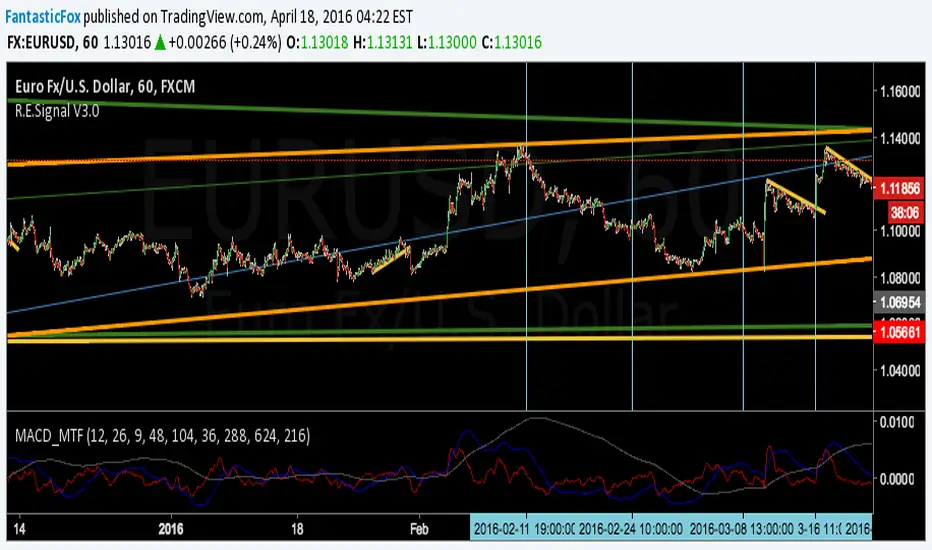
Please insert the indicator into 1h time-frame, otherwise you need to change the lengths' inputs.
When there are tops for two of the MACDs and they are near and close* to each other, there is a big opportunity of a "Major Top" for the security, and vice versa for "Major Bottom".
This indicator can be used for tracing multi time-frame divergence. Also, it could help traders to identify the waves of Elliott Wave, and as a signal for confirmation of an impulse after a correction or retracement.
* They should be on top of each others head, not crossing each other. not necessarily touching, but not so far from each other.
Skrip sumber terbuka
Dalam semangat sebenar TradingView, pencipta skrip ini telah menjadikannya sumber terbuka supaya pedagang dapat menilai dan mengesahkan kefungsiannya. Terima kasih kepada penulis! Walaupun anda boleh menggunakannya secara percuma, ingat bahawa menerbitkan semula kod ini adalah tertakluk kepada Peraturan Dalaman kami.
Penafian
Maklumat dan penerbitan adalah tidak dimaksudkan untuk menjadi, dan tidak membentuk, nasihat untuk kewangan, pelaburan, perdagangan dan jenis-jenis lain atau cadangan yang dibekalkan atau disahkan oleh TradingView. Baca dengan lebih lanjut di Terma Penggunaan.