OPEN-SOURCE SCRIPT
BPCO Z-Score
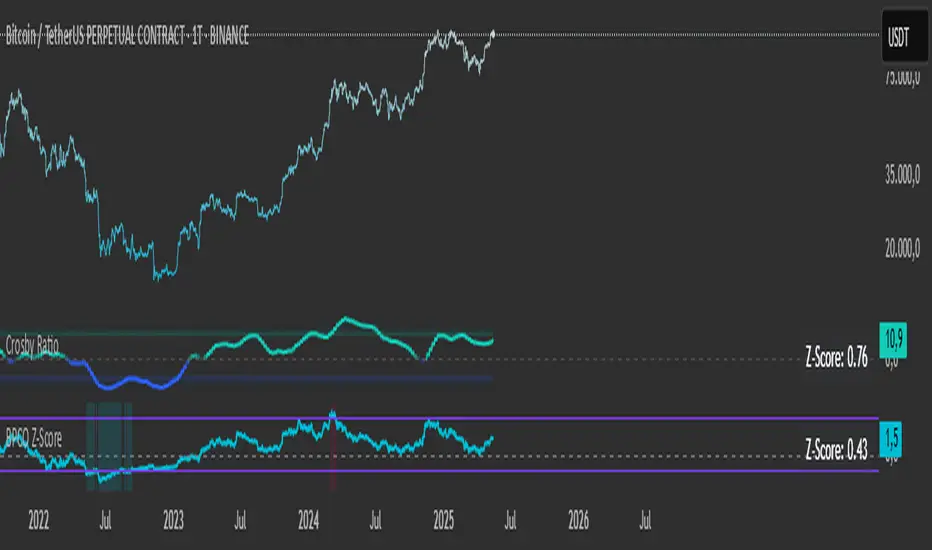
BPCO Z-Score with Scaled Z-Value and Table
Description:
This custom indicator calculates the Z-Score of a specified financial instrument (using the closing price as a placeholder for the BPCO value), scales the Z-Score between -2 and +2 based on user-defined thresholds, and displays it in a table for easy reference.
The indicator uses a simple moving average (SMA) and standard deviation to calculate the original Z-Score, and then scales the Z-Score within a specified range (from -2 to +2) based on the upper and lower thresholds set by the user.
Additionally, the scaled Z-Score is displayed in a separate table on the right side of the chart, providing a clear, numerical value for users to track and interpret.
Key Features:
BPCO Z-Score: Calculates the Z-Score using a simple moving average and standard deviation over a user-defined window (default: 365 days). This provides a measure of how far the current price is from its historical average in terms of standard deviations.
Scaled Z-Score: The original Z-Score is then scaled between -2 and +2, based on the user-specified upper and lower thresholds. The thresholds default to 3.5 (upper) and -1.5 (lower), and can be adjusted as needed.
Threshold Bands: Horizontal lines are plotted on the chart to represent the upper and lower thresholds. These help visualize when the Z-Score crosses critical levels, indicating potential market overbought or oversold conditions.
Dynamic Table Display: The scaled Z-Score is shown in a dynamic table at the top-right of the chart, providing a convenient reference for traders. The table updates automatically as the Z-Score fluctuates.
How to Use:
Adjust Time Window: The "Z-Score Period (Days)" input allows you to adjust the time period used for calculating the moving average and standard deviation. By default, this is set to 365 days (1 year), but you can adjust this depending on your analysis needs.
Set Upper and Lower Thresholds: Use the "BPCO Upper Threshold" and "BPCO Lower Threshold" inputs to define the bands for your Z-Score. The default values are 3.5 for the upper band and -1.5 for the lower band, but you can adjust them based on your strategy.
Interpret the Z-Score: The Z-Score provides a standardized measure of how far the current price (or BPCO value) is from its historical mean, relative to the volatility. A value above the upper threshold (e.g., 3.5) may indicate overbought conditions, while a value below the lower threshold (e.g., -1.5) may indicate oversold conditions.
Use the Scaled Z-Score: The scaled Z-Score is calculated based on the original Z-Score, but it is constrained to a range between -2 and +2. When the BPCO value hits the upper threshold (3.5), the scaled Z-Score will be +2, and when it hits the lower threshold (-1.5), the scaled Z-Score will be -2. This gives you a clear, easy-to-read value to interpret the market's condition.
Data Sources:
BPCO Data: In this indicator, the BPCO value is represented by the closing price of the asset. The calculation of the Z-Score and scaled Z-Score is based on this price data, but you can modify it to incorporate other data streams as needed (e.g., specific economic indicators or custom metrics).
Indicator Calculation: The Z-Score is calculated using the following formulas:
Mean (SMA): A simple moving average of the BPCO (close price) over the selected period (365 days by default).
Standard Deviation (Std): The standard deviation of the BPCO (close price) over the same period.
Z-Score: (Current BPCO - Mean) / Standard Deviation
Scaled Z-Score: The Z-Score is normalized to fall within a specified range (from -2 to +2), based on the upper and lower threshold inputs.
Important Notes:
Customization: The indicator allows users to adjust the period (window) for calculating the Z-Score, as well as the upper and lower thresholds to suit different timeframes and trading strategies.
Visual Aids: Horizontal lines are drawn to represent the upper and lower threshold levels, making it easy to visualize when the Z-Score crosses critical levels.
Limitations: This indicator relies on historical price data (or BPCO) and assumes that the standard deviation and mean are representative of future price behavior. It does not account for potential market shifts or extreme events that may fall outside historical norms.
Skrip sumber terbuka
Dalam semangat TradingView sebenar, pencipta skrip ini telah menjadikannya sumber terbuka, jadi pedagang boleh menilai dan mengesahkan kefungsiannya. Terima kasih kepada penulis! Walaupuan anda boleh menggunakan secara percuma, ingat bahawa penerbitan semula kod ini tertakluk kepada Peraturan Dalaman.
Penafian
Maklumat dan penerbitan adalah tidak bertujuan, dan tidak membentuk, nasihat atau cadangan kewangan, pelaburan, dagangan atau jenis lain yang diberikan atau disahkan oleh TradingView. Baca lebih dalam Terma Penggunaan.