OPEN-SOURCE SCRIPT
Telah dikemas kini [blackcat] L3 Bull Bear Game
Level 3
Background
A bull bear banker fund game trajectories.
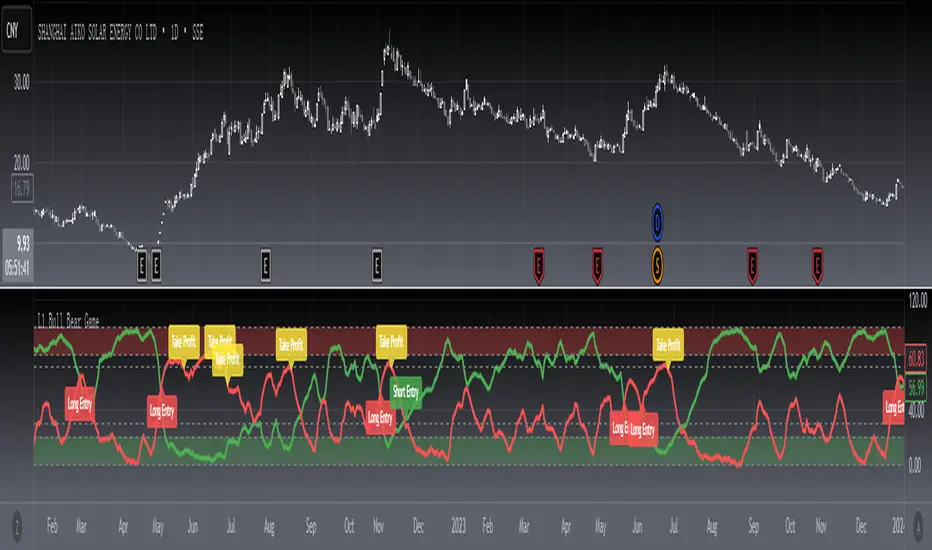
Function
This technical indicator draws a track diagram of the long-short power comparison through a custom trend line. The red curve represents the long line, and the green curve represents the short line. When the red line crosses the green line, it means that the upward momentum is sufficient, the whale is controlling the market, and the rise is imminent, which is a buy signal. When the red line enters the strong zone, it means that the whale is in control of the stock, and the stock is about to enter the stage of pulling up. On the contrary, if the green line turns upwards, it means that the whale is washing or retreating, and we must quickly reduce or clear the position. Sometimes when the indicator sends out a long entry signal, because the whale still has to go through a round of washing, I introduced a golden pit inflection point filter scheme, which can filter out these signals, so only when the signals appear at the same time is a long entry point signal.
Remarks
Feedbacks are appreciated.
Background
A bull bear banker fund game trajectories.
Function
This technical indicator draws a track diagram of the long-short power comparison through a custom trend line. The red curve represents the long line, and the green curve represents the short line. When the red line crosses the green line, it means that the upward momentum is sufficient, the whale is controlling the market, and the rise is imminent, which is a buy signal. When the red line enters the strong zone, it means that the whale is in control of the stock, and the stock is about to enter the stage of pulling up. On the contrary, if the green line turns upwards, it means that the whale is washing or retreating, and we must quickly reduce or clear the position. Sometimes when the indicator sends out a long entry signal, because the whale still has to go through a round of washing, I introduced a golden pit inflection point filter scheme, which can filter out these signals, so only when the signals appear at the same time is a long entry point signal.
Remarks
Feedbacks are appreciated.
Nota Keluaran
OVERVIEWThe BlackCat L3 Bull Bear Game is a comprehensive trading strategy that combines momentum indicators with custom-weighted calculations to generate precise entry and exit signals. This script utilizes advanced technical analysis techniques to identify potential trade opportunities in both bullish and bearish market conditions. The system employs unique weighted moving averages and strength indicators to provide traders with reliable entry points while incorporating protective stop-loss levels and take-profit targets.
FEATURES
• 💎 Custom Weighted Moving Average: Utilizes sophisticated calculation methods for more accurate trend identification
• 📈 Bullish Strength Indicator: Measures upward price momentum using high-low ranges
• 🐻 Bearish Strength Indicator: Evaluates downward pressure through similar range-based calculations
• ⚡ Dynamic Entry Signals: Generates real-time buy/sell alerts based on crossover patterns
• 🛑 Risk Management: Includes built-in risk parameters and take-profit thresholds
• 📊 Visual Feedback: Provides clear labeling of trading signals directly on the chart
HOW TO USE
Open the TradingView Platform
Navigate to Pine Editor and paste this script
Configure input parameters according to your trading preferences: • Set Overbought Level (default: 80) • Define Oversold Level (default: 20) • Adjust Take-Profit Target (default: 71) • Modify Bull/Bear Threshold (default: 30)
Monitor the generated signals on your chart
Follow entry/exit labels for trade execution guidance
LIMITATIONS
⚠️ Please note:
• Performance may vary across different timeframes and asset classes
• Past performance does not guarantee future results
• Always conduct thorough backtesting before live implementation
• Consider combining with additional confirmation tools for enhanced accuracy
Skrip sumber terbuka
Dalam semangat TradingView sebenar, pencipta skrip ini telah menjadikannya sumber terbuka, jadi pedagang boleh menilai dan mengesahkan kefungsiannya. Terima kasih kepada penulis! Walaupuan anda boleh menggunakan secara percuma, ingat bahawa penerbitan semula kod ini tertakluk kepada Peraturan Dalaman.
Avoid losing contact!Don't miss out! The first and most important thing to do is to join my Discord chat now! Click here to start your adventure: discord.com/invite/ZTGpQJq 防止失联,请立即行动,加入本猫聊天群: discord.com/invite/ZTGpQJq
Penafian
Maklumat dan penerbitan adalah tidak bertujuan, dan tidak membentuk, nasihat atau cadangan kewangan, pelaburan, dagangan atau jenis lain yang diberikan atau disahkan oleh TradingView. Baca lebih dalam Terma Penggunaan.