OPEN-SOURCE SCRIPT
SSRO Z-Score
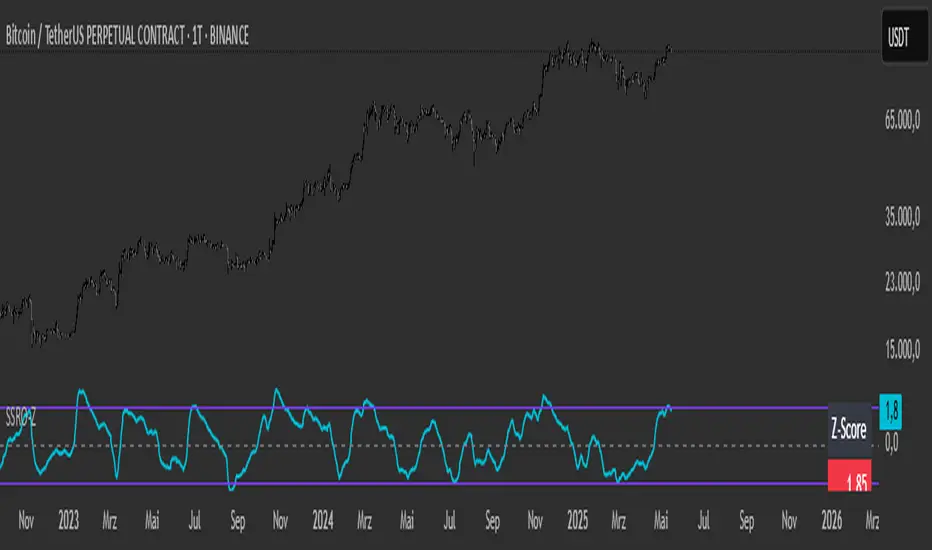
SSRO Z-Score Indicator — Description
What it does:
This indicator measures the Stablecoin Supply Ratio (SSR) relative to Bitcoin’s market cap and calculates a normalized Z-Score of this ratio to help identify potential market tops and bottoms in the crypto market.
How it works:
The Stablecoin Supply Ratio (SSR) is calculated by dividing Bitcoin’s market capitalization by the combined market capitalization of major stablecoins (USDT, USDC, TUSD, DAI, FRAX).
The SSR is then smoothed over a user-defined lookback period to reduce noise.
A Z-Score is computed by normalizing the SSR over a specified moving window, which shows how far the current SSR deviates from its historical average in terms of standard deviations.
This Z-Score is further smoothed using an exponential moving average (EMA) to filter short-term volatility.
How to read the Z-Score:
Z-Score = 0: SSR is at its historical average.
Z-Score > 0: SSR is above average, indicating Bitcoin’s market cap is relatively high compared to stablecoin supply, potentially signaling bullish market conditions.
Z-Score < 0: SSR is below average, indicating stablecoin supply is high relative to Bitcoin’s market cap, possibly signaling bearish pressure or increased liquidity waiting to enter the market.
Upper and Lower Bands: These user-defined levels (e.g., +2 and -2) represent thresholds for extreme conditions. Values above the upper band may indicate overbought or overheated market conditions, while values below the lower band may indicate oversold or undervalued conditions.
Additional Features:
A dynamic table displays a linear scaled Z-Score alongside the main plot, clamped between -2 and +2 relative to the upper and lower bands for intuitive interpretation.
Usage Tips:
Combine the SSRO Z-Score with other technical indicators or volume analysis for more reliable signals.
Look for divergence between price and Z-Score extremes as potential reversal signals.
Skrip sumber terbuka
Dalam semangat TradingView sebenar, pencipta skrip ini telah menjadikannya sumber terbuka, jadi pedagang boleh menilai dan mengesahkan kefungsiannya. Terima kasih kepada penulis! Walaupuan anda boleh menggunakan secara percuma, ingat bahawa penerbitan semula kod ini tertakluk kepada Peraturan Dalaman.
Penafian
Maklumat dan penerbitan adalah tidak bertujuan, dan tidak membentuk, nasihat atau cadangan kewangan, pelaburan, dagangan atau jenis lain yang diberikan atau disahkan oleh TradingView. Baca lebih dalam Terma Penggunaan.