OPEN-SOURCE SCRIPT
Telah dikemas kini Table rsi multiframes(by Lc_M)
- Simultaneous display of RSI values on cells corresponding to each selected timeframe, organized in an intuitive table, adjustable in size and position.
- Color indicator on each cell that presents RSI values within the overbought and oversold levels. example: if the user wants to set the O.S/O.B levels to 20 - 80, the colored cells will only appear at "RSI" => 80 and "RSI" <= 20.
- Free configuration of graphic times, lengths and O.B/O.S, according to user standards
Nota Keluaran
Bug fixNota Keluaran
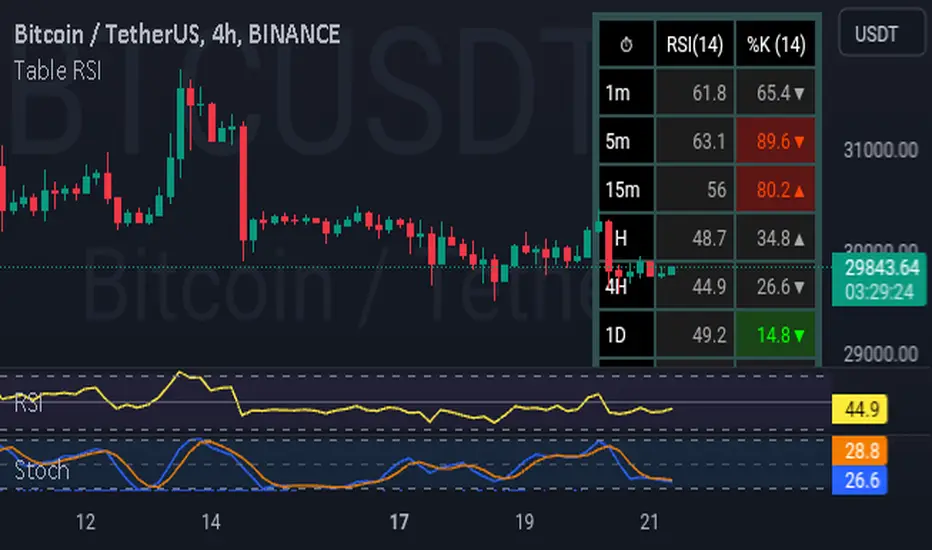
This table groups together a set of values referring to the RSI of each selected timeframe so that the user can follow them simultaneously.And to serve users who seek a more refined analysis, especially in the short term, a new column was implemented in this upgrade, containing the values of the stochastic indicator.
Check the Feat:
► Table with size and position adjustment, and selection of up to 7 different timeframes.
► COLUMN RSI: displays the values corresponding to each TF, allowing the user to adjust the length and font.
► COLOR INDICATOR ABOUT THE CELL: as the RSI reaches overbought/oversold levels, the cells tend to change their colors to red (RSI >= O.B) or green (RSI <= O.S), whatever the chart period.
((NOTE)): The O.B/O.S standards can be modified by the user, the color indicator automatically adapts to the established standards.
UPDATES:
•►► ENABLE/DISABLE TIMEFRAME: allows the user to keep a smaller amount of TF to be displayed in the table, as desired.
•►► STOCHASTIC OSCILLATOR : column with stochastic oscillator values for short-term analysis, with adjustments for %K Length, %K Smooth and %D values.
•►► COLOR INDICATOR ABOUT CELL: The functionality applied to RSI values is also applicable to stochastic values. It is worth mentioning that the adjustments of one do not interfere with the other, each one is individually adjustable.
•►► DIRECTIONAL ARROW: applicable only to the Stochastic column, this function informs the user when the value of line %K is above or below the value of line %D.
Skrip sumber terbuka
Dalam semangat sebenar TradingView, pencipta skrip ini telah menjadikannya sumber terbuka supaya pedagang dapat menilai dan mengesahkan kefungsiannya. Terima kasih kepada penulis! Walaupun anda boleh menggunakannya secara percuma, ingat bahawa menerbitkan semula kod ini adalah tertakluk kepada Peraturan Dalaman kami.
Penafian
Maklumat dan penerbitan adalah tidak dimaksudkan untuk menjadi, dan tidak membentuk, nasihat untuk kewangan, pelaburan, perdagangan dan jenis-jenis lain atau cadangan yang dibekalkan atau disahkan oleh TradingView. Baca dengan lebih lanjut di Terma Penggunaan.