PROTECTED SOURCE SCRIPT
NBSG Mox-Z
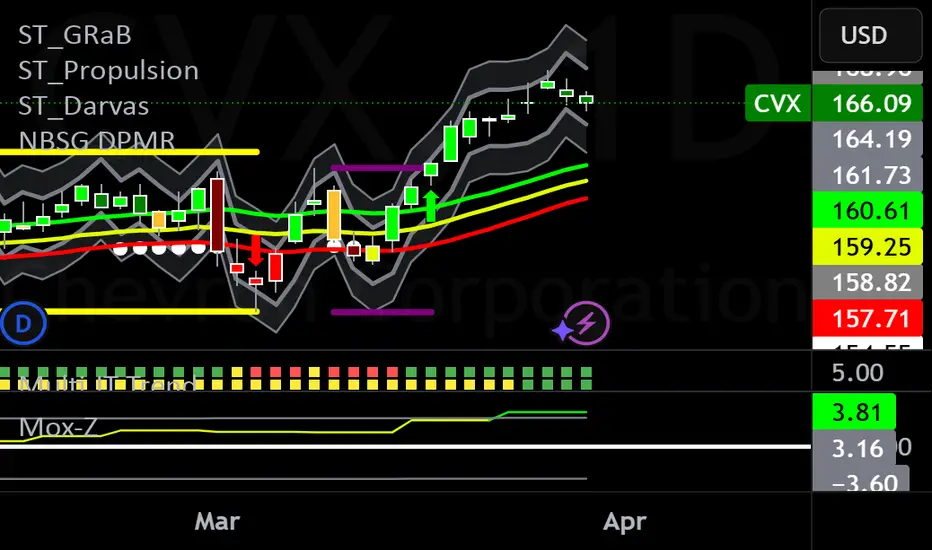
The Mox-Z provides a visual representation of momentum and trend strength, enhanced with statistical bands to identify significant levels based on prior momentum.
What It Does
The indicator calculates the Mox-Z value as (EMA12(close) - EMA26(close)) - EMA9(EMA12(close) - EMA26(close))) * 3 using the higher timeframe's closing prices. This value is plotted as a histogram, with colors indicating its position relative to zero and Z-score bands:
Bright Green: Above +0.7 SD (strong bullish momentum).
Bright Red: Below -0.7 SD (strong bearish momentum).
Dark Green: Above zero but below +0.7 SD (moderate bullish momentum).
Dark Red: Below zero but above -0.7 SD (moderate bearish momentum).
Z-score bands are computed over a 200-period lookback on the higher timeframe, using a 0.7 multiplier on the standard deviation, offering a statistical context for the histogram's values.
How to Use It
Use the histogram to gauge momentum shifts on the selected higher timeframe (e.g., weekly momentum on a daily chart).
Bright colors (green/red) suggest potential overextension or strong trend continuation, useful for timing entries or exits.
Dark colors indicate moderate momentum, often signaling consolidation or early trend development.
The ±0.7 SD bands (gray lines) highlight statistically significant levels, aiding in identifying extremes relative to the past 200 periods of the chosen timeframe.
Originality and Purpose
Unlike standard MACD histograms, this script replicates the Mox-Z Indicator's unique scaling (*3 multiplier) and applies it strictly to higher timeframe data, avoiding current timeframe bias. The addition of Z-score bands provides a statistical edge, making it distinct from typical momentum indicators while maintaining simplicity for practical trading.
Settings
Higher Timeframe: Default is "1W" (weekly), but adjust to any timeframe higher than your chart (e.g., "1D" for daily, "1M" for monthly).
This indicator is ideal for traders seeking a higher timeframe momentum perspective with clear visual cues, without relying on complex multi-indicator setups.
Skrip dilindungi
Skrip ini diterbitkan sebagai sumber tertutup. Akan tetapi, anda boleh menggunakannya dengan percuma dan tanpa had – ketahui lebih lanjut di sini.
Penafian
Maklumat dan penerbitan adalah tidak dimaksudkan untuk menjadi, dan tidak membentuk, nasihat untuk kewangan, pelaburan, perdagangan dan jenis-jenis lain atau cadangan yang dibekalkan atau disahkan oleh TradingView. Baca dengan lebih lanjut di Terma Penggunaan.