OPEN-SOURCE SCRIPT
Daily Volume Ratio Bands (20MA)
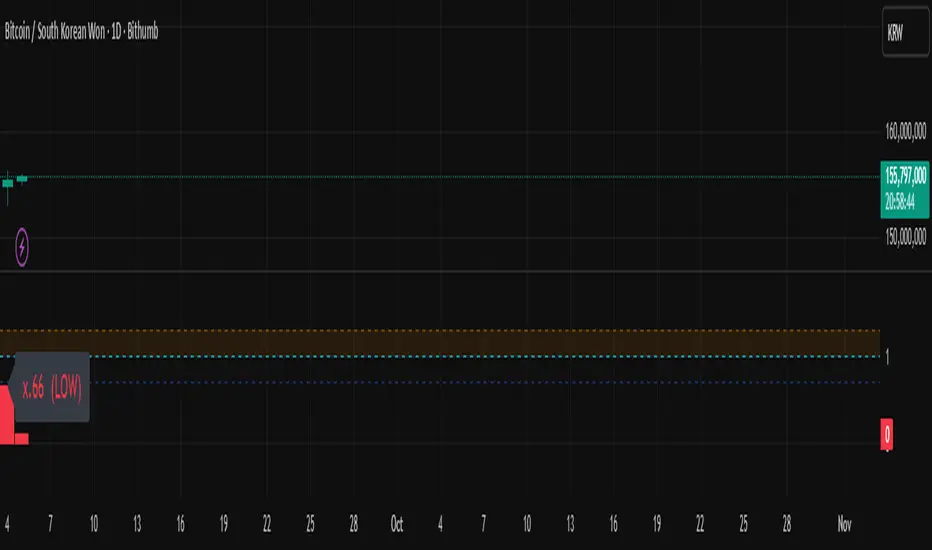
Daily Volume Ratio Bands (20MA) — by CryptoDaily
This indicator normalizes daily trading volume against the recent 20-day moving average (20MA) and plots it as a volume ratio.
It allows traders to quickly identify whether current volume is strong, weak, or within a normal range compared to historical averages.
Key Features
Normalized volume ratio with 20-day average = baseline (1.0)
Clear bands for easy interpretation (1.0 ~ 1.3 = normal, above = overheated, below = weak)
Intuitive color coding:
🟨 Yellow: Normal range (1.0 ~ 1.3)
🔵 Blue: Above 1.3× average (high/strong volume, breakout confirmation)
⚪️ Gray: Below average (low volume)
🔴 Red: At or below 0.7× (extremely low volume / lack of interest)
How to Use
Breakouts with strong volume (Blue) → higher confidence in trend continuation
Gray/Red during consolidation → signal of weak momentum or sideways phase
Quickly assess whether the market is in overheated or low-activity conditions
Notes
Designed for Daily timeframe (1D) only. It will not function properly on intraday charts.
For educational purposes only. This is not financial advice.
Author
CryptoDaily (YouTube & TradingView)
YouTube channel: cryptodaily_tv
Skrip sumber terbuka
Dalam semangat sebenar TradingView, pencipta skrip ini telah menjadikannya sumber terbuka supaya pedagang dapat menilai dan mengesahkan kefungsiannya. Terima kasih kepada penulis! Walaupun anda boleh menggunakannya secara percuma, ingat bahawa menerbitkan semula kod ini adalah tertakluk kepada Peraturan Dalaman kami.
Penafian
Maklumat dan penerbitan adalah tidak dimaksudkan untuk menjadi, dan tidak membentuk, nasihat untuk kewangan, pelaburan, perdagangan dan jenis-jenis lain atau cadangan yang dibekalkan atau disahkan oleh TradingView. Baca dengan lebih lanjut di Terma Penggunaan.