OPEN-SOURCE SCRIPT
2013-2025 Eclipses
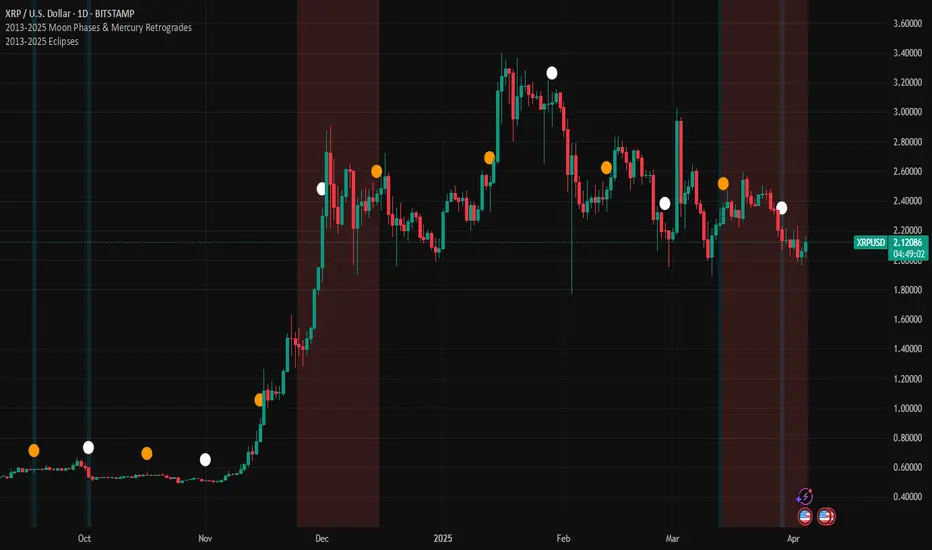
Indicator Description: 2013-2025 Eclipses
This Pine Script (version 5) indicator overlays solar and lunar eclipse events on a TradingView chart, covering the period from 2013 to 2025. It is designed for traders and astrology enthusiasts who wish to visualize these significant astronomical events alongside price action, potentially identifying correlations with market movements or key turning points.
Features:
Eclipses:
Visualization: Displayed as a semi-transparent aqua background highlight across the chart.
Data: Includes 48 specific eclipse dates (both solar and lunar) from April 25, 2013, to September 21, 2025.
Purpose: Highlights dates of eclipses, which are often considered powerful astrological events associated with sudden changes, revelations, or significant shifts in energy and market sentiment.
Technical Details:
Overlay: The indicator is set to overlay=true, ensuring it displays directly on the price chart rather than in a separate pane.
Date Matching: Utilizes a helper function is_date(y, m, d) to determine if the current chart date matches any of the predefined eclipse dates, using TradingView's year, month, and dayofmonth variables.
Visualization Method:
bgcolor: Applies a light aqua background (using color.new(color.aqua, 85)) on the specific dates of eclipses. The transparency level of 85 allows price action to remain visible through the highlight.
Time Range: Spans from April 2013 to September 2025, covering a 12+ year period of eclipse events.
Usage:
Add the script to your TradingView chart to see eclipse dates highlighted with an aqua background on your chosen symbol and timeframe.
The background highlight appears only on the exact dates of eclipses, making it easy to spot these events amidst price data.
Ideal for those incorporating astrological analysis into trading or studying the potential impact of eclipses on financial markets.
Notes:
The script uses a single-line definition for eclipse_dates to ensure compatibility with Pine Script v5 syntax and avoid line continuation errors.
The aqua color matches the original circle-based visualization, with transparency adjustable via the color.new(color.aqua, 85) parameter (0 = fully opaque, 100 = fully transparent).
Works best on daily or higher timeframes for clear visibility of individual eclipse dates, though it functions on any TradingView-supported timeframe.
Eclipse dates should be cross-checked with astronomical sources for critical applications, as the script relies on the provided data accuracy.
Purpose:
This indicator provides a straightforward way to track eclipses over a 12-year period, offering a visual representation of these potent celestial events. By using a background highlight instead of markers, it maintains chart clarity while emphasizing the specific days when eclipses occur, potentially aiding in the analysis of their influence on market behavior or personal trading strategies.
Skrip sumber terbuka
Dalam semangat TradingView sebenar, pencipta skrip ini telah menjadikannya sumber terbuka, jadi pedagang boleh menilai dan mengesahkan kefungsiannya. Terima kasih kepada penulis! Walaupuan anda boleh menggunakan secara percuma, ingat bahawa penerbitan semula kod ini tertakluk kepada Peraturan Dalaman.
Penafian
Maklumat dan penerbitan adalah tidak bertujuan, dan tidak membentuk, nasihat atau cadangan kewangan, pelaburan, dagangan atau jenis lain yang diberikan atau disahkan oleh TradingView. Baca lebih dalam Terma Penggunaan.