OPEN-SOURCE SCRIPT
Telah dikemas kini Ultimate Regression Channel v5.0 [WhiteStone_Ibrahim]
Ultimate Regression Channel v5.0: Comprehensive User Guide
This indicator is designed to visualize the current trend, potential support/resistance levels, and market volatility through a statistical analysis of price action. At its core, it plots a regression line (a trend line) based on prices over a specific period and adds channels based on standard deviation around this line.
1. Core Features and Settings
Length Mode:
Numerical (Manual): You define the number of bars to be used for the regression channel calculation. You can use lower values (e.g., 50-100) for short-term analysis and higher values (e.g., 200-300) to identify long-term trends.
Automatic (Based on Market Structure): This mode automatically draws the channel starting from the highest high or lowest low that has formed within the Auto Scan Period. This allows the indicator to adapt itself to significant market turning points (swing points), which is highly useful.
Regression Model:
Linear: Calculates the trend as a straight line. It generally works well in stable, short-to-medium-term trends.
Logarithmic: Calculates the trend as a curved line. It more accurately reflects price action, especially on long-term charts or for assets that experience exponential growth/decline (like cryptocurrencies or growth stocks).
Channel Widths:
These settings determine how far from the central trend line (in terms of standard deviations) the channels will be drawn.
The 0 (Inner), 1 (Middle), and 2 (Outer) channels represent the "normal" range of price movement and the "extreme" zones. Statistically, about 95% of all price action occurs within the outer channels (2nd standard deviation).
2. Visual Extras and Their Interpretation
Breakout Style:
This feature alerts you when the price closes above the uppermost channel (Channel 2) with a green arrow/background or below the lowermost channel with a red arrow/background.
This is a very important signal. A breakout can signify that the current trend is strengthening and likely to continue (a breakout/trend-following strategy) or that the market has become overextended and may be due for a reversal (an exhaustion/top-bottom signal). It is critical to confirm this signal with other indicators (e.g., RSI, Volume).
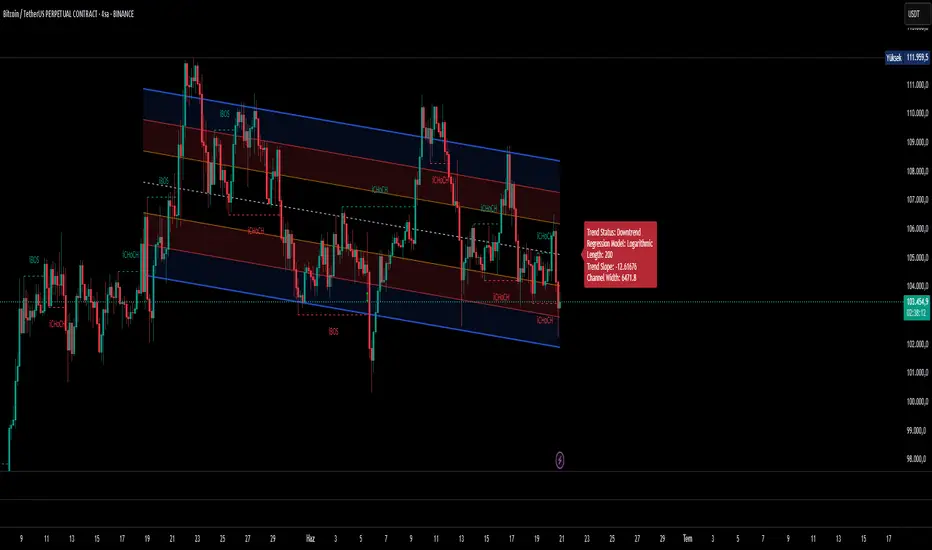
Info Label:
This provides an at-a-glance summary of the channel on the right side of the chart:
Trend Status: Identifies the trend as "Uptrend," "Downtrend," or "Sideways" based on the slope of the centerline. The Horizontal Threshold setting allows you to filter out noise by treating very small slopes as "Sideways."
Regression Model and Length: Shows your current settings.
Trend Slope: A numerical value representing how steep or weak the trend is.
Channel Width: Shows the price difference between the outermost channels. This is a measure of current volatility. A widening channel indicates increasing volatility, while a narrowing one indicates decreasing volatility.
3. What Users Should Pay Attention To & Best Practices
Define Your Strategy: Mean Reversion or Breakout?
Mean Reversion: If the market is in a ranging or gently trending phase, the price will tend to revert to the centerline after hitting the outer channels (overbought/oversold zones). In this case, the outer channels can be considered opportunities to sell (upper channel) or buy (lower channel).
Breakout: If a strong trend is in place, a price close beyond an outer channel can be a sign that the trend is accelerating. In this scenario, one might consider taking a position in the direction of the breakout. Correctly analyzing the current market state (ranging vs. trending) is key to deciding which strategy to employ.
Don't Use It in Isolation: No indicator is a holy grail. Use the Regression Channel in conjunction with other tools. Confirm signals with RSI divergences for overbought/oversold conditions, Moving Averages for the overall trend direction, or Volume indicators to confirm the strength of a breakout.
Choose the Right Model: On shorter-term charts (e.g., 1-hour, 4-hour), the Linear model is often sufficient. However, on long-term charts like the daily, weekly, or monthly, the Logarithmic model will provide much more accurate results, especially for assets with parabolic movements.
The Power of Automatic Mode: The Automatic length mode is often the most practical choice because it finds the most logical starting point for you. It saves you the trouble of adjusting settings, especially when analyzing different assets or timeframes.
Use the Alerts: If you don't want to miss the moment the price touches a key channel line, set up an alert from the Alert Settings section for your desired line (e.g., only the "Outer Channels"). This helps you catch opportunities even when you are not in front of the screen.
This indicator is designed to visualize the current trend, potential support/resistance levels, and market volatility through a statistical analysis of price action. At its core, it plots a regression line (a trend line) based on prices over a specific period and adds channels based on standard deviation around this line.
1. Core Features and Settings
Length Mode:
Numerical (Manual): You define the number of bars to be used for the regression channel calculation. You can use lower values (e.g., 50-100) for short-term analysis and higher values (e.g., 200-300) to identify long-term trends.
Automatic (Based on Market Structure): This mode automatically draws the channel starting from the highest high or lowest low that has formed within the Auto Scan Period. This allows the indicator to adapt itself to significant market turning points (swing points), which is highly useful.
Regression Model:
Linear: Calculates the trend as a straight line. It generally works well in stable, short-to-medium-term trends.
Logarithmic: Calculates the trend as a curved line. It more accurately reflects price action, especially on long-term charts or for assets that experience exponential growth/decline (like cryptocurrencies or growth stocks).
Channel Widths:
These settings determine how far from the central trend line (in terms of standard deviations) the channels will be drawn.
The 0 (Inner), 1 (Middle), and 2 (Outer) channels represent the "normal" range of price movement and the "extreme" zones. Statistically, about 95% of all price action occurs within the outer channels (2nd standard deviation).
2. Visual Extras and Their Interpretation
Breakout Style:
This feature alerts you when the price closes above the uppermost channel (Channel 2) with a green arrow/background or below the lowermost channel with a red arrow/background.
This is a very important signal. A breakout can signify that the current trend is strengthening and likely to continue (a breakout/trend-following strategy) or that the market has become overextended and may be due for a reversal (an exhaustion/top-bottom signal). It is critical to confirm this signal with other indicators (e.g., RSI, Volume).
Info Label:
This provides an at-a-glance summary of the channel on the right side of the chart:
Trend Status: Identifies the trend as "Uptrend," "Downtrend," or "Sideways" based on the slope of the centerline. The Horizontal Threshold setting allows you to filter out noise by treating very small slopes as "Sideways."
Regression Model and Length: Shows your current settings.
Trend Slope: A numerical value representing how steep or weak the trend is.
Channel Width: Shows the price difference between the outermost channels. This is a measure of current volatility. A widening channel indicates increasing volatility, while a narrowing one indicates decreasing volatility.
3. What Users Should Pay Attention To & Best Practices
Define Your Strategy: Mean Reversion or Breakout?
Mean Reversion: If the market is in a ranging or gently trending phase, the price will tend to revert to the centerline after hitting the outer channels (overbought/oversold zones). In this case, the outer channels can be considered opportunities to sell (upper channel) or buy (lower channel).
Breakout: If a strong trend is in place, a price close beyond an outer channel can be a sign that the trend is accelerating. In this scenario, one might consider taking a position in the direction of the breakout. Correctly analyzing the current market state (ranging vs. trending) is key to deciding which strategy to employ.
Don't Use It in Isolation: No indicator is a holy grail. Use the Regression Channel in conjunction with other tools. Confirm signals with RSI divergences for overbought/oversold conditions, Moving Averages for the overall trend direction, or Volume indicators to confirm the strength of a breakout.
Choose the Right Model: On shorter-term charts (e.g., 1-hour, 4-hour), the Linear model is often sufficient. However, on long-term charts like the daily, weekly, or monthly, the Logarithmic model will provide much more accurate results, especially for assets with parabolic movements.
The Power of Automatic Mode: The Automatic length mode is often the most practical choice because it finds the most logical starting point for you. It saves you the trouble of adjusting settings, especially when analyzing different assets or timeframes.
Use the Alerts: If you don't want to miss the moment the price touches a key channel line, set up an alert from the Alert Settings section for your desired line (e.g., only the "Outer Channels"). This helps you catch opportunities even when you are not in front of the screen.
Nota Keluaran
bug fix! pinescirpt v6 update :)Skrip sumber terbuka
Dalam semangat TradingView sebenar, pencipta skrip ini telah menjadikannya sumber terbuka, jadi pedagang boleh menilai dan mengesahkan kefungsiannya. Terima kasih kepada penulis! Walaupuan anda boleh menggunakan secara percuma, ingat bahawa penerbitan semula kod ini tertakluk kepada Peraturan Dalaman.
Penafian
Maklumat dan penerbitan adalah tidak bertujuan, dan tidak membentuk, nasihat atau cadangan kewangan, pelaburan, dagangan atau jenis lain yang diberikan atau disahkan oleh TradingView. Baca lebih dalam Terma Penggunaan.
Skrip sumber terbuka
Dalam semangat TradingView sebenar, pencipta skrip ini telah menjadikannya sumber terbuka, jadi pedagang boleh menilai dan mengesahkan kefungsiannya. Terima kasih kepada penulis! Walaupuan anda boleh menggunakan secara percuma, ingat bahawa penerbitan semula kod ini tertakluk kepada Peraturan Dalaman.
Penafian
Maklumat dan penerbitan adalah tidak bertujuan, dan tidak membentuk, nasihat atau cadangan kewangan, pelaburan, dagangan atau jenis lain yang diberikan atau disahkan oleh TradingView. Baca lebih dalam Terma Penggunaan.