PROTECTED SOURCE SCRIPT
Smart Market Structure Pro v11 (All-in-One Awareness Tool)
Smart Market Structure Pro v11 (All-in-One Awareness Tool)
📖 Purpose
This indicator is designed to help traders learn and visualize market structure concepts such as trend, order blocks, fair value gaps, and volatility zones.
It combines multiple institutional awareness tools into one framework to improve clarity and educational understanding of market dynamics.
This script is for educational use only — not for financial advice or trade recommendations.
🧠 Concept Overview
The indicator automatically identifies the following elements:
- Fair Value Gaps (FVG) – Gaps between candles showing inefficiencies.
- Order Blocks (OB) – Institutional footprints indicating potential reaction zones.
- Directional Fibonacci Levels – Auto-drawn from recent swing highs/lows.
- EMA Trend Filter – Confirms directional bias visually.
- Volume Confirmation – Highlights strong impulsive moves.
- Auto Trendlines & S/R Zones – Drawn dynamically from pivots.
- Session Filter – Restricts signals to custom trading hours.
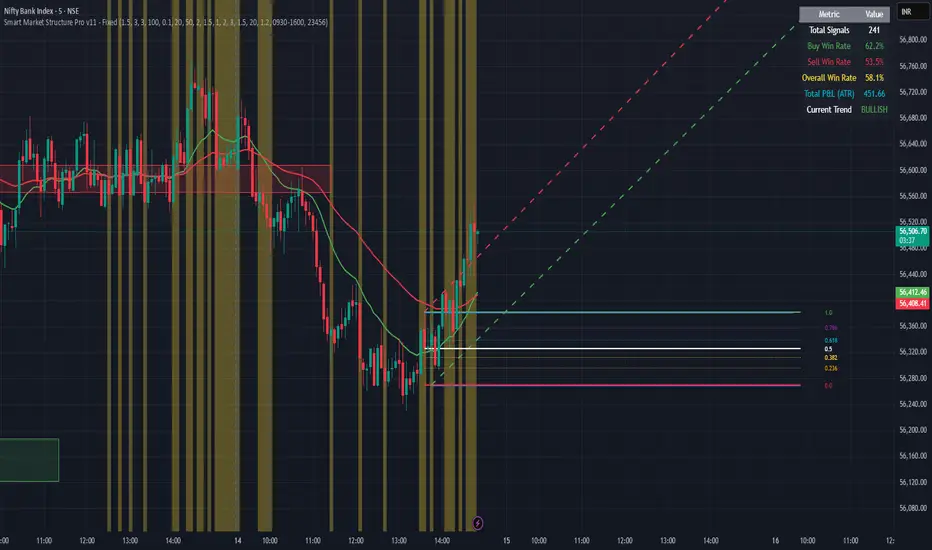
- Stats Dashboard – Tracks trend bias, win rate, and cumulative P&L (ATR-based).
⚙️ Main Features
✅ Fair Value Gap Detection – Bullish/bearish gaps shaded for clarity.
✅ Order Block Highlighting – Marks high-volume impulsive zones.
✅ Automatic Fibonacci Plot – 0.236–0.786 retracements for structure study.
✅ EMA (20/50) Filter – Simple visual trend confirmation.
✅ Dynamic Trendlines – Auto-adjust with market swings.
✅ ATR-Based SL/TP Levels – Calculates projected ranges for awareness.
✅ Volume Spike Markers – Identify strong liquidity moments.
✅ Performance Metrics Table – Real-time stats on trades and trend.
✅ Alert System – Notifications for key structure events.
🧭 Educational Logic
- Confluence Visualization: When FVG, OB, and EMA align → strong structural bias.
- Risk Awareness: ATR and R:R logic demonstrate volatility-based target planning.
- Trend Understanding: EMA + volume context help identify impulsive vs corrective phases.
📊 Dashboard Parameters
Displays live:
- Total Buy/Sell setups
- Win rate (%)
- Net P&L in ATR units
- Active trend bias
💡 Best For
- Learners studying Smart Money Concepts (SMC) and institutional market logic.
- Traders wanting to visualize structure and volatility zones in one view.
- Anyone practicing confluence-based strategy development for self-education.
⚠️ Disclaimer
This script is created for awareness and educational demonstration only.
It does not provide buy/sell signals or financial advice.
Use it as a visual guide for learning and analysis — apply independent judgment and risk management.
📖 Purpose
This indicator is designed to help traders learn and visualize market structure concepts such as trend, order blocks, fair value gaps, and volatility zones.
It combines multiple institutional awareness tools into one framework to improve clarity and educational understanding of market dynamics.
This script is for educational use only — not for financial advice or trade recommendations.
🧠 Concept Overview
The indicator automatically identifies the following elements:
- Fair Value Gaps (FVG) – Gaps between candles showing inefficiencies.
- Order Blocks (OB) – Institutional footprints indicating potential reaction zones.
- Directional Fibonacci Levels – Auto-drawn from recent swing highs/lows.
- EMA Trend Filter – Confirms directional bias visually.
- Volume Confirmation – Highlights strong impulsive moves.
- Auto Trendlines & S/R Zones – Drawn dynamically from pivots.
- Session Filter – Restricts signals to custom trading hours.
- Stats Dashboard – Tracks trend bias, win rate, and cumulative P&L (ATR-based).
⚙️ Main Features
✅ Fair Value Gap Detection – Bullish/bearish gaps shaded for clarity.
✅ Order Block Highlighting – Marks high-volume impulsive zones.
✅ Automatic Fibonacci Plot – 0.236–0.786 retracements for structure study.
✅ EMA (20/50) Filter – Simple visual trend confirmation.
✅ Dynamic Trendlines – Auto-adjust with market swings.
✅ ATR-Based SL/TP Levels – Calculates projected ranges for awareness.
✅ Volume Spike Markers – Identify strong liquidity moments.
✅ Performance Metrics Table – Real-time stats on trades and trend.
✅ Alert System – Notifications for key structure events.
🧭 Educational Logic
- Confluence Visualization: When FVG, OB, and EMA align → strong structural bias.
- Risk Awareness: ATR and R:R logic demonstrate volatility-based target planning.
- Trend Understanding: EMA + volume context help identify impulsive vs corrective phases.
📊 Dashboard Parameters
Displays live:
- Total Buy/Sell setups
- Win rate (%)
- Net P&L in ATR units
- Active trend bias
💡 Best For
- Learners studying Smart Money Concepts (SMC) and institutional market logic.
- Traders wanting to visualize structure and volatility zones in one view.
- Anyone practicing confluence-based strategy development for self-education.
⚠️ Disclaimer
This script is created for awareness and educational demonstration only.
It does not provide buy/sell signals or financial advice.
Use it as a visual guide for learning and analysis — apply independent judgment and risk management.
Skrip dilindungi
Skrip ini diterbitkan sebagai sumber tertutup. Akan tetapi, anda boleh menggunakannya dengan percuma dan tanpa had – ketahui lebih lanjut di sini.
Penafian
Maklumat dan penerbitan adalah tidak dimaksudkan untuk menjadi, dan tidak membentuk, nasihat untuk kewangan, pelaburan, perdagangan dan jenis-jenis lain atau cadangan yang dibekalkan atau disahkan oleh TradingView. Baca dengan lebih lanjut di Terma Penggunaan.