OPEN-SOURCE SCRIPT
Telah dikemas kini Futures Weekly Open Range

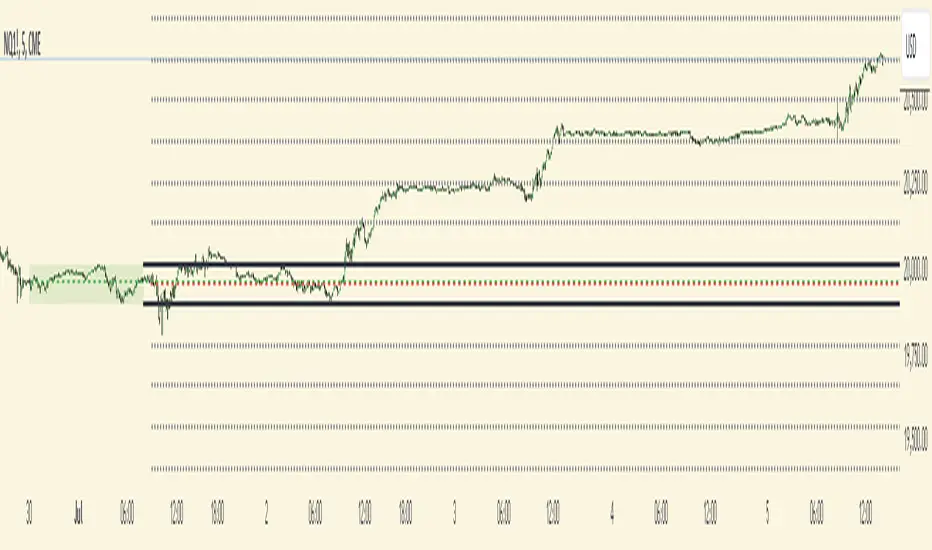
The weekly opening range (high to low) is calculated from the open of the market on Sunday (1800 EST) till the opening of the Bond Market on Monday morning (0800 EST). This is the first and most crucial range for the trading week. As ICT has taught, price is moving through an algorithm and as such is fractal; because price is fractal, the opening range can be calculated and projected to help determine if price is trending or consolidating. As well; this indicator can be used to incorporate his PO3 concept to enter above the weekly opening range for shorts if bearish, or entering below the opening range for longs if bullish.
This indicator takes the high and low of weekly opening range, plots those two levels, plots the opening price for the new week, and calculates the Standard Deviations of the range and plots them both above and below of the weekly opening range. These are all plotted through the week until the start of the new week.
At this time the indicator will only plot the Standard deviation lines on the minutes time frame below 1 hour.
Only the range and range lines will be plotted on the hourly chart.
This indicator takes the high and low of weekly opening range, plots those two levels, plots the opening price for the new week, and calculates the Standard Deviations of the range and plots them both above and below of the weekly opening range. These are all plotted through the week until the start of the new week.
- The range is calculated by subtracting the high from the low during the specified time.
- The mid-point is half of that range added to the low.
- The Standard deviation is multiples of the range (up to 10) added to the high and subtracted
from the low.
At this time the indicator will only plot the Standard deviation lines on the minutes time frame below 1 hour.
Only the range and range lines will be plotted on the hourly chart.
Nota Keluaran
*Fixed indicator painting on daily and higher time frames.Nota Keluaran
Fixed ChartSkrip sumber terbuka
Dalam semangat TradingView sebenar, pencipta skrip ini telah menjadikannya sumber terbuka, jadi pedagang boleh menilai dan mengesahkan kefungsiannya. Terima kasih kepada penulis! Walaupuan anda boleh menggunakan secara percuma, ingat bahawa penerbitan semula kod ini tertakluk kepada Peraturan Dalaman.
Penafian
Maklumat dan penerbitan adalah tidak bertujuan, dan tidak membentuk, nasihat atau cadangan kewangan, pelaburan, dagangan atau jenis lain yang diberikan atau disahkan oleh TradingView. Baca lebih dalam Terma Penggunaan.
Skrip sumber terbuka
Dalam semangat TradingView sebenar, pencipta skrip ini telah menjadikannya sumber terbuka, jadi pedagang boleh menilai dan mengesahkan kefungsiannya. Terima kasih kepada penulis! Walaupuan anda boleh menggunakan secara percuma, ingat bahawa penerbitan semula kod ini tertakluk kepada Peraturan Dalaman.
Penafian
Maklumat dan penerbitan adalah tidak bertujuan, dan tidak membentuk, nasihat atau cadangan kewangan, pelaburan, dagangan atau jenis lain yang diberikan atau disahkan oleh TradingView. Baca lebih dalam Terma Penggunaan.