PROTECTED SOURCE SCRIPT
Manipulation Candle 15m
Manipulation Candle
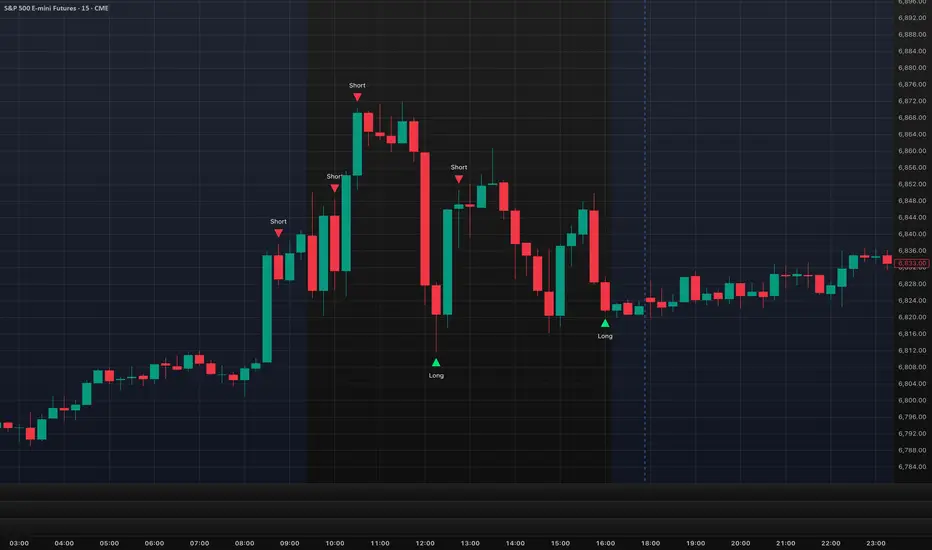
The Manipulation Candle 15m indicator is designed to highlight potential market manipulation or exhaustion moves on the 15-minute chart by identifying large impulsive candles relative to the Daily ATR and fading them contrarian-style.
This tool is especially useful for index futures, SPX options, and high-liquidity instruments where sharp moves often precede mean reversion.
How It Works -
The script monitors completed 15-minute candles
It measures the candle body size (open → close)
That body is compared to a user-defined percentage of the Daily ATR (set to 20%)
When a candle exceeds the threshold, it is considered an impulse / manipulation candle
Signal Logic (Contrarian Bias) -
Bearish impulse candle → LONG signal
Indicates aggressive selling that may be exhausted
Bullish impulse candle → SHORT signal
Indicates aggressive buying that may be overextended
Signals are only generated once per completed 15-minute candle to avoid repainting.
Inputs -
Daily ATR Length
Controls how volatility is measured
Impulse Threshold (% of ATR)
Defines how large a candle must be (relative to Daily ATR) to trigger a signal
Best Use Cases
Mean-reversion and fade strategies
SPX / ES / NQ / YM indices
Important Notes
This is not a standalone system
Works best with context, confirmation, and risk management
Designed to identify potential turning points, not trend continuation
Created by: aaronrileycheer
Timeframe: 15-Minute
Style: Contrarian / Mean Reversion
Skrip dilindungi
Skrip ini diterbitkan sebagai sumber tertutup. Akan tetapi, anda boleh menggunakannya secara bebas dan tanpa apa-apa had – ketahui lebih di sini.
Penafian
Maklumat dan penerbitan adalah tidak bertujuan, dan tidak membentuk, nasihat atau cadangan kewangan, pelaburan, dagangan atau jenis lain yang diberikan atau disahkan oleh TradingView. Baca lebih dalam Terma Penggunaan.