OPEN-SOURCE SCRIPT
Telah dikemas kini 63-Day Sector Relative Strength vs NIFTY
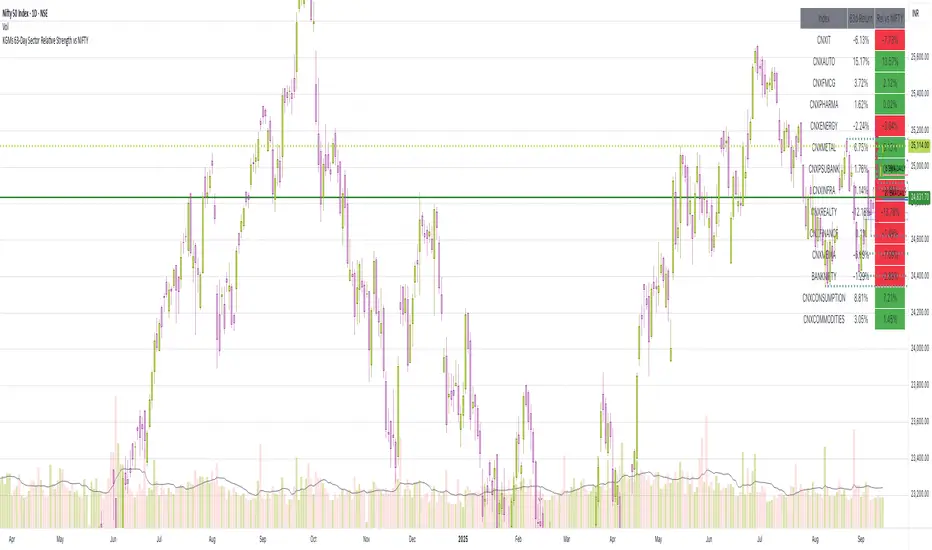
This script calculates and displays the 63-day returns of major NSE sectoral indices and their relative strength versus the NIFTY 50.
It,
Covered Indices: CNXIT, CNXAUTO, CNXFMCG, CNXPHARMA, CNXENERGY, CNXMETAL, CNXPSUBANK, CNXINFRA, CNXREALTY, CNXFINANCE, CNXMEDIA, BANKNIFTY, CNXCONSUMPTION, CNXCOMMODITIES
How to use this: Quickly identify which sectors are outperforming or underperforming relative to the NIFTY over the past 63 trading sessions (approx. 3 months).
It,
- [computes 63-day price returns for each sector index]
[calculates the relative performance of each sector against the Nifty 50]
[displays results in a table at the top right corner of the chart]
[highlights positive vs negative relative strength for quick comparision]
Covered Indices: CNXIT, CNXAUTO, CNXFMCG, CNXPHARMA, CNXENERGY, CNXMETAL, CNXPSUBANK, CNXINFRA, CNXREALTY, CNXFINANCE, CNXMEDIA, BANKNIFTY, CNXCONSUMPTION, CNXCOMMODITIES
How to use this: Quickly identify which sectors are outperforming or underperforming relative to the NIFTY over the past 63 trading sessions (approx. 3 months).
Nota Keluaran
This script calculates and displays the 63-day returns of major NSE sectoral indices and their relative strength versus the NIFTY 50.It,
- Computes 63-day price returns for each sector index.
- Calculates the relative performance of each sector against the NIFTY 50.
- Displays results in a neat table at the top-right corner of the chart.
- Highlights positive vs negative relative strength for quick comparison.
Covered Indices: CNXIT, CNXAUTO, CNXFMCG, CNXPHARMA, CNXENERGY, CNXMETAL, CNXPSUBANK, CNXINFRA, CNXREALTY, CNXFINANCE, CNXMEDIA, BANKNIFTY, CNXCONSUMPTION, CNXCOMMODITIES
Useful to quickly identify which sectors are outperforming or underperforming relative to the broader market (i.e. NIFTY) over the past 63 trading sessions (approx. 3 months). Useful for sector rotation analysis, relative momentum analysis and macro market views
Skrip sumber terbuka
Dalam semangat TradingView sebenar, pencipta skrip ini telah menjadikannya sumber terbuka, jadi pedagang boleh menilai dan mengesahkan kefungsiannya. Terima kasih kepada penulis! Walaupuan anda boleh menggunakan secara percuma, ingat bahawa penerbitan semula kod ini tertakluk kepada Peraturan Dalaman.
Penafian
Maklumat dan penerbitan adalah tidak bertujuan, dan tidak membentuk, nasihat atau cadangan kewangan, pelaburan, dagangan atau jenis lain yang diberikan atau disahkan oleh TradingView. Baca lebih dalam Terma Penggunaan.