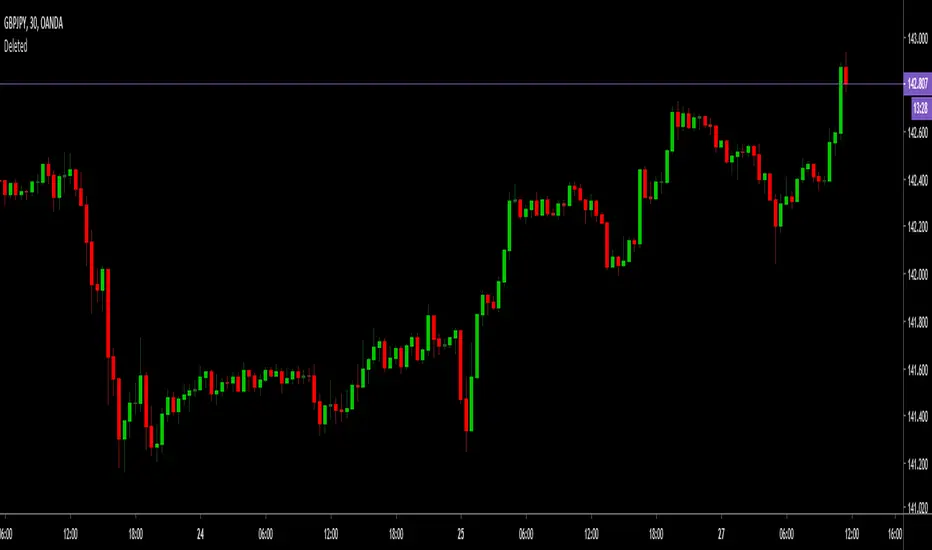
Hashem Helper -One

This indicator is mixture of WaveTrend and RSI with EMA Crosses.
There are 8 EMA (Ribbon) which in confluence of RSI and WaveTrend gives shapes above the candles.
SHAPES:
Red Diamond = Bearish Momentum in the trend.
Orange Cross = Probability of the following candles to be reverse back to the candle which has orange cross above it, is High. (Current price likely doesn't match up with the Statistics)
Purple Cross = Bearish Indication on the Candle. (Should be used in confluence of other Indications)
Aqua Circle = Bullish indication. (Based on EMA Crosses)
Purple Circle = Bearish Indication. (Based on EMA Crosses)
Blue Triangle = The EMA Ribbon is Recovering. Basically means a Probable Trend Change.
Note that this is a Helper Indicator, NOT a Short/Long Signal Indicator. This should be used alongside with your TA.
Combined with Hashem WaveTrend.
Skrip jemputan sahaja
Hanya pengguna disahkan oleh penulis boleh mengakses skrip ini. Anda perlu memohon dan mendapatkan kebenaran untuk menggunakannya. Keizinan selalunya diberikan selepas pembayaran. Untuk lebih butiran, ikuti arahan penulis di bawah atau hubungi rhawshemi secara terus.
TradingView TIDAK menyarankan pembayaran atau penggunaan skrip kecuali anda mempercayai sepenuhnya penulis dan memahami bagaimana ia berfungsi. Anda juga boleh menjumpai alternatif sumber terbuka dan percuma yang lain di dalam skrip komuniti kami.
Arahan penulis
Penafian
Skrip jemputan sahaja
Hanya pengguna disahkan oleh penulis boleh mengakses skrip ini. Anda perlu memohon dan mendapatkan kebenaran untuk menggunakannya. Keizinan selalunya diberikan selepas pembayaran. Untuk lebih butiran, ikuti arahan penulis di bawah atau hubungi rhawshemi secara terus.
TradingView TIDAK menyarankan pembayaran atau penggunaan skrip kecuali anda mempercayai sepenuhnya penulis dan memahami bagaimana ia berfungsi. Anda juga boleh menjumpai alternatif sumber terbuka dan percuma yang lain di dalam skrip komuniti kami.