OPEN-SOURCE SCRIPT
RVI Crossover Strategy[Kopottaja]
Overview of the RVI Crossover Strategy
Strategy Name: RVI Crossover Strategy
Purpose: The RVI Crossover Strategy is based on the crossover signals between the Relative Vigor Index (RVI) and its moving average signal line. This strategy aims to identify potential buy and sell signals by evaluating the market’s directional trend.
Key Indicator Features
Relative Vigor Index (RVI): This indicator measures the momentum of price changes over a specified period and helps identify the market’s current trend. The RVI is based on the idea that prices generally close higher than they open in an uptrend (and lower in a downtrend). The RVI helps provide an indication of the strength and direction of a trend.
Signal Line: A moving average (e.g., SMA) is applied to the RVI values, creating a "signal line." When the RVI crosses above or below this line, it signals a potential trading opportunity.
Calculations and Settings
Calculating the RVI: The RVI is calculated by comparing the difference between the close and open prices to the difference between high and low prices. This provides information about the direction and momentum of price movement:
RVI= Sum(SWMA(high−low))Sum(SWMA(close−open))
where SWMA is a smoothed weighted moving average over a specified period.
Signal Line Calculation: The RVI value is smoothed by applying a simple moving average (SMA) to create the signal line. This signal line helps filter crossover signals for improved accuracy.
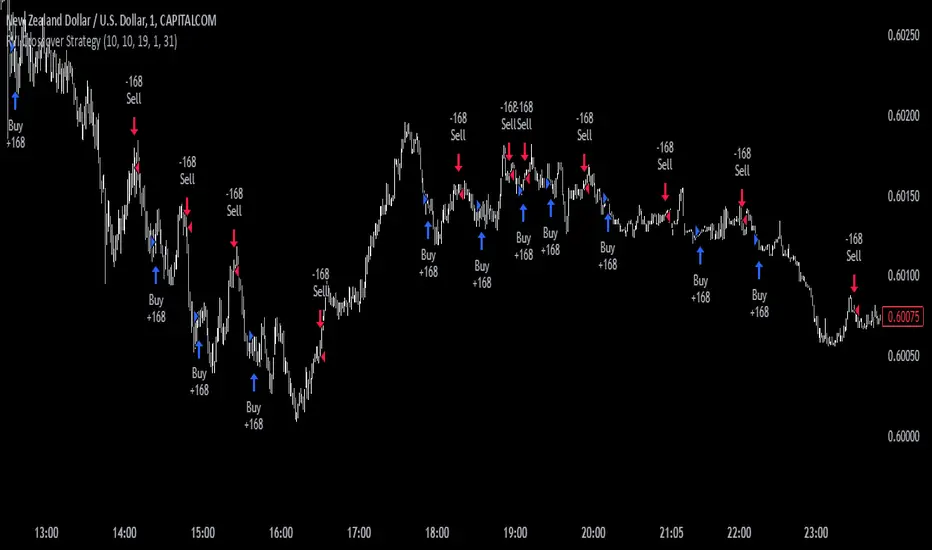
Buy and Sell Conditions: Buy and sell conditions are identified based on crossovers between the RVI and its signal line.
Buy Signal: A buy condition is triggered when the RVI crosses above the signal line, provided that the "Bearish" condition (trend confirmation) is met.
Sell Signal: A sell condition occurs when the RVI crosses below the signal line, alongside the "Bullish" trend confirmation.
Volume-Weighted Moving Averages (VWMA): VWMA indicators are used to assess price-volume relationships over different timeframes:
Fast VWMA: A short-period volume-weighted moving average.
Slow VWMA: A longer-period volume-weighted moving average. These values are used to strengthen the buy and sell conditions by confirming trend directions (Bullish or Bearish).
Disclaimer: This is an educational and informational tool. Past performance is not indicative of future results. Always backtest before using in live markets
Strategy Name: RVI Crossover Strategy
Purpose: The RVI Crossover Strategy is based on the crossover signals between the Relative Vigor Index (RVI) and its moving average signal line. This strategy aims to identify potential buy and sell signals by evaluating the market’s directional trend.
Key Indicator Features
Relative Vigor Index (RVI): This indicator measures the momentum of price changes over a specified period and helps identify the market’s current trend. The RVI is based on the idea that prices generally close higher than they open in an uptrend (and lower in a downtrend). The RVI helps provide an indication of the strength and direction of a trend.
Signal Line: A moving average (e.g., SMA) is applied to the RVI values, creating a "signal line." When the RVI crosses above or below this line, it signals a potential trading opportunity.
Calculations and Settings
Calculating the RVI: The RVI is calculated by comparing the difference between the close and open prices to the difference between high and low prices. This provides information about the direction and momentum of price movement:
RVI= Sum(SWMA(high−low))Sum(SWMA(close−open))
where SWMA is a smoothed weighted moving average over a specified period.
Signal Line Calculation: The RVI value is smoothed by applying a simple moving average (SMA) to create the signal line. This signal line helps filter crossover signals for improved accuracy.
Buy and Sell Conditions: Buy and sell conditions are identified based on crossovers between the RVI and its signal line.
Buy Signal: A buy condition is triggered when the RVI crosses above the signal line, provided that the "Bearish" condition (trend confirmation) is met.
Sell Signal: A sell condition occurs when the RVI crosses below the signal line, alongside the "Bullish" trend confirmation.
Volume-Weighted Moving Averages (VWMA): VWMA indicators are used to assess price-volume relationships over different timeframes:
Fast VWMA: A short-period volume-weighted moving average.
Slow VWMA: A longer-period volume-weighted moving average. These values are used to strengthen the buy and sell conditions by confirming trend directions (Bullish or Bearish).
Disclaimer: This is an educational and informational tool. Past performance is not indicative of future results. Always backtest before using in live markets
Skrip sumber terbuka
Dalam semangat TradingView sebenar, pencipta skrip ini telah menjadikannya sumber terbuka, jadi pedagang boleh menilai dan mengesahkan kefungsiannya. Terima kasih kepada penulis! Walaupuan anda boleh menggunakan secara percuma, ingat bahawa penerbitan semula kod ini tertakluk kepada Peraturan Dalaman.
Penafian
Maklumat dan penerbitan adalah tidak bertujuan, dan tidak membentuk, nasihat atau cadangan kewangan, pelaburan, dagangan atau jenis lain yang diberikan atau disahkan oleh TradingView. Baca lebih dalam Terma Penggunaan.