Forex Insight Pro 2.0
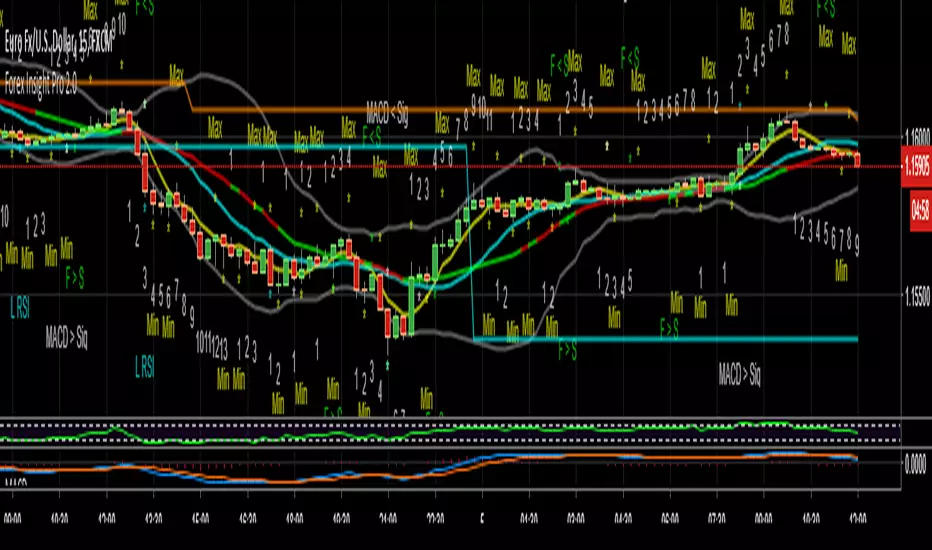
Forex Insight Pro 2.0 for TradingView gives you abilities to see the stories hiding in the graphs of markets. It marks important parameters that are happening on the graph including:
- Helps you to label the numbers from sequential counting of CCX which compares the Close price of the right bar to the Close price of the left bar in a group of X price bars. For example CC5 will compare the Close of right bar (current bar) to the Close of left bar in a group of 5 price bars (right, left and other 3 bars in the middle). If the close of right bar is higher than the close of left bar, an increasing number will be printed above the right bar. On the other hand, an increasing number will be printed below the right bar if the close of right bar is lower than the close of left bar. Sequences of consecutive increasing numbers above or below the price bars indicate buying or selling pressure in the market.
- Helps you to generate CCX Support and Resistance levels which are the highest or lowest prices in the range of settable number of bars. For example, if 9 consecutive CC5 below the price bars is specified, the resistance line will be plotted at the highest price of the most recent 9 bars. Similarly, if 9 consecutive CC5 above the price bars is specified, the support line will be plotted at the lowest price of the most recent 9 bars. These CC5 support and resistance levels often become important price structures in the graph for breakout or trend reversal later on.
- Helps you to notice whether the level of MACD is increasing or decreasing by plotting Bollinger bands with the middle band coded in colors. The red middle band means the MACD is decreasing and the green middle band means the MACD is increasing. Increasing or decreasing MACD values may warn you of following increasing or decreasing prices. The Bollinger middle band also play an important role in determination of the price trend. The prices below and above the middle Bollinger band often indicate on going downtrend and uptrend, respectively. Increasing MACD while the Bollinger bands are squeezed often followed by band expansion and price breakout upward. On the other hand, decreasing MACD while the Bollinger bands are squeezed often followed by band expansion and price breakout downward.
- Helps you to notice high level of RSI value by printing "H RSI" above the price bar if the RSI value is greater than the preset value such as 70% or notice low level of RSI value by printing "L RSI" below the price bar if the RSI value is less than the preset value such as 30%. The "H RSI" and "L RSI" could be used as warning signs that the reversal of the price trend might follow in the near future.
- Helps you to notice the crossing of MACD line and its smoothing Signal line by printing "MACD > Sig" below the price bar if the MACD line crosses above the Signal line and printing "MACD < Sig" above the price bar if the MACD line crosses below the Signal line. Crossing of MACD and Signal lines could be used as warning signs that the reversal of the price trend might follow in the near future.
- Helps you to notice the crossing of MACD line between the positive and negative zones by printing "MACD > 0" below the price bar if the MACD line changes to positive region and printing "MACD < 0" above the price bar if the MACD line crosses into the negative region. Changing the sign of MACD value could be used as warning signs that the reversal of the price trend might follow in the near future.
- Helps you to notice the crossing of the fast simple moving average line and slow simple moving average line by printing "F > S" below the price bar if the fast SMA line crosses above the slow SMA line and printing "F < S" above the price bar if the fast SMA line crosses below the slow SMA line. Crossings of fast and slow SMA often indicate reversal of the price trends.
- Helps you to label the Local Maximum and Local Minimum bars. If the high price of the middle bar inside a group of 3 bars is higher than its left and right neighbors, the label "Max" is printed above that middle price bar. Similarly, the label "Min" is printed below that middle price bar if the low price of it inside a group of 3 bars is lower than those of its left and right neighbors. Local Maximum and Minimum helps a lot in drawing the most recent supply and demand lines in which the price may breakout from.
Parameters of features in the above list could be changed, or turned on/off easily in the input options.
The source code of Forex Insight Pro 2.0 custom indicator is protected. Only invited TradingView members can apply this indicator to their forex, crypto currencies and stock price charts. Lifetime invitation is for 100 USD with free future upgrade and online support. Rental invitation is for 10 USD/month. Paypal and Bitcoin payments are welcome.
The author (Nimit Chomnawang, Ph.D) can be contacted at [ tradingview.com/u/nimit.chomnawang ]
Fast SMA = 2
Slow SMA = 3
Bollinger band period = 14
*Go to the bottom of this page and click on "Add to Favorite Scripts".
*Open a new chart and click on the "Indicators" tab.
*Click on the "Favorites" tab and choose "Forex Insight Pro 2.0".
*Right click anywhere on the graph, choose "Settings".
*In "Style" tab, choose the Dark Theme.
*In "Background" tab, uncheck "Indicator Arguments" and "Indicator Values".
*In "Timezone/Sessions" tab, choose Time Zone = Exchange.
*At the bottom of settings window, click on "Template", "SaveAs...", then name this theme of graph setting for future call up such as "Forex Insight Pro".
*Click OK.
*For free TradingView plan, you can add two more indicators to the chart. That means you may add RSI and MACD indicators with same parameters as those setup in Forex Insight Pro.
Skrip jemputan sahaja
Hanya pengguna yang diberikan kebenaran oleh penulis mempunyai akses kepada skrip ini dan ini selalunya memerlukan pembayaran. Anda boleh menambahkan skrip kepada kegemaran anda tetapi anda hanya boleh menggunakannya selepas meminta kebenaran dan mendapatkannya daripada penulis — ketarhui lebih lanjut di sini. Untuk lebih butiran, ikuti arahan penulis di bawah atau hubungi nimit.chomnawang secara terus.
TradingView tidak menyarankan pembayaran untuk atau menggunakan skrip kecuali anda benar-benar mempercayai penulisnya dan memahami bagaimana ia berfungsi. Anda juga boleh mendapatkan alternatif sumber terbuka lain yang percuma dalam skrip komuniti kami.
Arahan penulis
Amaran: sila baca panduan kami untuk skrip jemputan sahaja sebelum memohon akses.
Please do not ask about access to use scripts in the script's comment section.
Penafian
Skrip jemputan sahaja
Hanya pengguna yang diberikan kebenaran oleh penulis mempunyai akses kepada skrip ini dan ini selalunya memerlukan pembayaran. Anda boleh menambahkan skrip kepada kegemaran anda tetapi anda hanya boleh menggunakannya selepas meminta kebenaran dan mendapatkannya daripada penulis — ketarhui lebih lanjut di sini. Untuk lebih butiran, ikuti arahan penulis di bawah atau hubungi nimit.chomnawang secara terus.
TradingView tidak menyarankan pembayaran untuk atau menggunakan skrip kecuali anda benar-benar mempercayai penulisnya dan memahami bagaimana ia berfungsi. Anda juga boleh mendapatkan alternatif sumber terbuka lain yang percuma dalam skrip komuniti kami.
Arahan penulis
Amaran: sila baca panduan kami untuk skrip jemputan sahaja sebelum memohon akses.
Please do not ask about access to use scripts in the script's comment section.