OPEN-SOURCE SCRIPT
Racer Correlation [racer8]
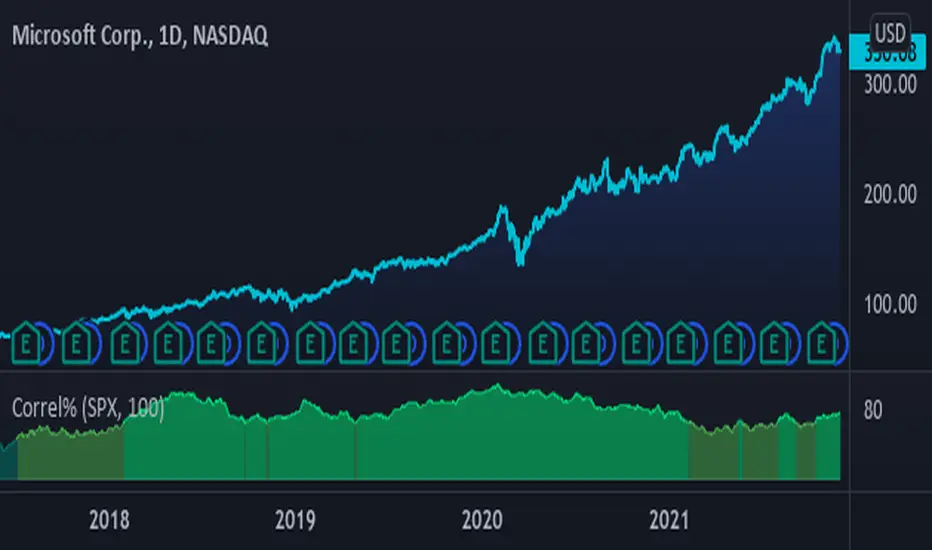
This indicator gauges correlation between 2 markets using my own method I invented. It is far superior to the correlation coefficient in that it maintains steady correlation values, meaning less false signals regarding correlation. Yet, the indicator's calculation is very simple in fact...
It simply calculates the percentage of moves in the same direction as the other market. So if MSFT moved in the same direction as SPX 80% of the time, then the indicator would show you a value of 80. Unlike correlation coefficient, you can calculate exactly how many of MSFT's bars moved in the same direction as SPX's bars. Everytime MSFT moves in the same direction as SPX, it is included in the percentage of positively correlated moves.
Closing prices are used solely in the indicator's calculations. All indicator values represent a percentage. Also, I recommend a length of at least 100 periods.
Values between 0% and 25% indicate strong negative correlation. (bright red)
Values between 25% and 33% indicate moderate negative correlation. (red)
Values between 33% and 50% indicate weak negative correlation. (dark red)
Values between 50% and 67% indicate weak positive correlation. (dark green)
Values between 67% and 75% indicate moderate positive correlation. (green)
Values between 75% and 100% indicate strong positive correlation. (bright green)........Enjoy :)
Skrip sumber terbuka
Dalam semangat TradingView sebenar, pencipta skrip ini telah menjadikannya sumber terbuka, jadi pedagang boleh menilai dan mengesahkan kefungsiannya. Terima kasih kepada penulis! Walaupuan anda boleh menggunakan secara percuma, ingat bahawa penerbitan semula kod ini tertakluk kepada Peraturan Dalaman.
Penafian
Maklumat dan penerbitan adalah tidak bertujuan, dan tidak membentuk, nasihat atau cadangan kewangan, pelaburan, dagangan atau jenis lain yang diberikan atau disahkan oleh TradingView. Baca lebih dalam Terma Penggunaan.