PROTECTED SOURCE SCRIPT
Telah dikemas kini [ayana] TFPS - TradFi Pressure Score
TFPS - TradFi Pressure Score: Your Market Pressure Barometer
Understand what moves Wall Street, before it moves Crypto.
This indicator is your real-time barometer for the influence of traditional financial markets (TradFi) on Crypto. It measures the combined pressure from four key quadrants—Risk Appetite (S&P 500), Market Stress (VIX), Liquidity (DXY), and Macro Expectations (US10Y)—to answer one question: "Do I have a tailwind or a headwind from the global markets?"
How to Read Your "Cockpit" in 60 Seconds
The Main Line (Overall Market Pressure)
GREEN / ABOVE 0: Bullish Tailwind. The macro environment is supportive for Crypto.
RED / BELOW 0: Bearish Headwind. The macro environment is creating pressure on Crypto.
BRIGHT Color: Pressure is ACCELERATING.
DARK Color: Pressure is DECELERATING (losing momentum).
The Dashboard (Your Command Center)
Lead/Lag Analysis: The game-changer. Tells you if TradFi is currently leading the price or vice-versa. This is your key to knowing whether to watch macro news or focus on crypto-specifics.
TradFi Influence (R²): Shows you HOW RELEVANT the macro pressure is right now. High R² means Wall Street's influence is dominant. Low R² means crypto is moving on its own narrative.
Dynamic Weights: Reveals the market's primary NARRATIVE. Is the pressure coming from Fear (VIX), Liquidity (DXY), or general Risk Appetite (SPX)?
Extreme Signals (Reversal Zones)
Stress Cloud (Z-Score): Large, opaque bars warn of statistically EXTREME greed or fear levels.
Extreme Dots: Pinpoint the moments when pressure has likely reached an unsustainable peak, often preceding turning points.
Key Strategies & Use Cases
As a Trend Filter: Simply avoid fighting the color. Don't force long trades when the TFPS shows a strong red headwind.
For Precision Entry/Exits: Use the Extreme Dots and a decelerating color on the Main Line to time your entries in confluence with your own strategy.
For Strategic Decisions: Use the Lead/Lag and R² metrics to decide where to focus your attention and how to manage portfolio risk based on the current macro regime.
Configuration
For best results, leave the engine settings on their default (auto-adaptive) mode. The indicator's core intelligence lies in its ability to adapt to changing market dynamics automatically. You can adjust the visual theme to match your chart.
Nota Keluaran
TFPS: The Intelligent Navigation System for a TradFi-Driven MarketThe market isn't just random noise. It’s driven by powerful capital flows and overarching narratives from Traditional Finance (TradFi). In today's interconnected world, analyzing crypto in a vacuum is a losing strategy. Bitcoin and other digital assets have evolved into high-beta risk assets, their movements deeply intertwined with the macro-economic tides.
The TFPS is your professional-grade cockpit to navigate this reality. It doesn't just tell you if there's a headwind; it tells you how strong that wind is, where it's coming from, and if you can use it to anticipate the market's next turn. This latest version introduces a new layer of intelligence and visual clarity to give you an unparalleled edge.
What's New in This Version? Smarter Analysis, Cleaner Visuals.
This is not just an update; it's a refinement of the core engine and user interface based on professional feedback. We've focused on providing more actionable information while reducing chart noise and potential misinterpretations.
🚀 NEW: Momentum Shift Markers (The Diamonds): The score line now features optional diamond markers (💎) that pinpoint the exact bar where momentum shifts. These act as powerful, early warnings of a potential change in trend, allowing for more precise timing. Use the "Alternate Markers" option to see only the first signal of a new directional move, keeping your chart exceptionally clean.
🚀 UPGRADE: Intelligent, Context-Aware Dashboard: The dashboard is now smarter. It understands the context of your analysis and hides irrelevant data. The Strategic R², which is based on daily data, will now automatically be hidden on intraday timeframes (like 4H or 1H) to prevent misinterpretation.
🚀 UPGRADE: More Robust & Adaptive Engine: The core calculation for Lead/Lag analysis has been refactored for greater stability and historical accuracy. Furthermore, the adaptive lookback logic now also applies to the Lead/Lag scan, using a wider search on lower timeframes and a more focused one on higher timeframes for more relevant results.
🚀 UPGRADE: In-Depth Educational Tooltips: We have completely overhauled the settings panel with highly detailed tooltips. Each setting is now explained with clear, practical advice, turning the indicator itself into a learning tool.
How to Read Your Cockpit in 60 Seconds
The Main Line & Visuals (The Pressure Gauge)
GREEN / ABOVE 0: Bullish Tailwind. The macro environment is supportive.
RED / BELOW 0: Bearish Headwind. The macro environment is creating pressure.
BRIGHT Color: Pressure is ACCELERATING (strong momentum).
DARK Color: Pressure is DECELERATING (losing momentum).
💎 DIAMOND MARKERS: Your early warning. Pinpoints the exact moment momentum shifts.
Z-SCORE BANDS/HISTOGRAM: The "Fear & Greed" meter. Large histogram bars and breakouts of the bands signal statistically extreme pressure that often precedes reversals.
The Dashboard (Your Command Center)
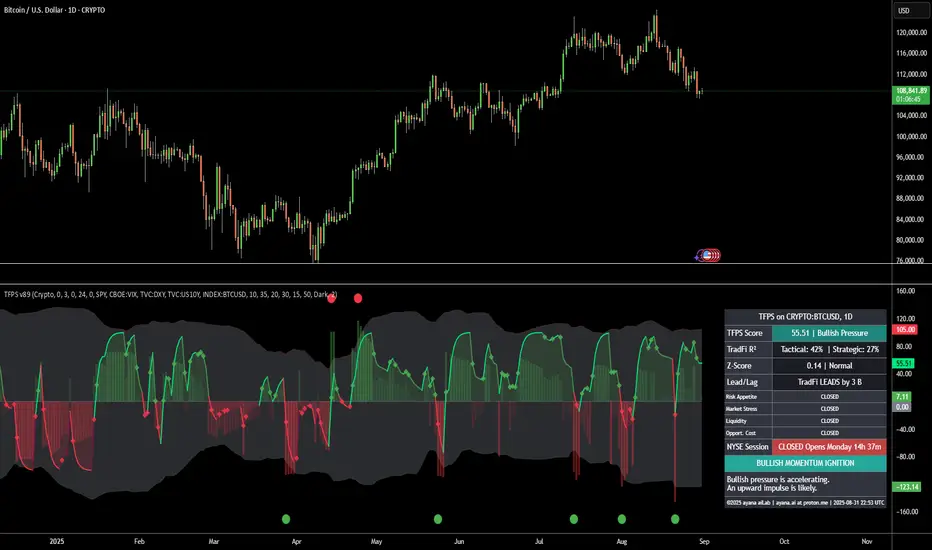
TFPS Score: Your at-a-glance reading of the overall macro pressure.
Z-Score: Measures statistical extremes. "EXTREME" status with a percentage shows how far into unsustainable territory the market is.
Lead/Lag Analysis: The game-changer. Tells you if TradFi pressure is currently
leading your asset's price, and provides a Confidence Indicator (CI) to gauge the signal's strength.
TradFi Influence (R²): The relevance meter. Quantifies how much of your asset's movement is explained by TradFi. Divided into
Tactical (Intraday) and Strategic (Daily+) for multi-timeframe analysis.
Dynamic Weights: Reveals the market's primary narrative. Is pressure coming from Risk Appetite (SPX), Market Stress (VIX), Liquidity (DXY), or Opportunity Cost (US10Y)? The color-coding makes the dominant driver instantly visible.
Key Strategies & Use Cases
As a Regime Filter: The most powerful use case. Don't fight the macro tide. Avoid forcing long trades when the TFPS shows a strong, high-R² bearish headwind.
For Precision Timing: Use the new Diamond Markers in confluence with a decelerating color and an extreme Z-Score reading to pinpoint high-probability entry and exit zones.
For Narrative Analysis: Use the R² and the color-coded Dynamic Weights to understand WHY the market is moving. This context is true alpha.
Configuration & Quick Start
Select your Asset Class Preset (Crypto, Equities, Commodities). This is the quickest way to get started.
For most use cases, leave the engine settings on their default (0 = Auto-Adaptive). The indicator's core intelligence lies in its ability to adapt automatically.
Explore the new visual settings to customize the Momentum Markers to your liking.
This tool was built to move you from guessing about market narratives to measuring them with quantitative precision. Welcome to a more intelligent way of trading.
©2025 ayana aiLab | For feedback or inquiries, contact ayana.ai at proton.me
Nota Keluaran
Dark Theme presetNota Keluaran
Deleted 2nd indicator on screenNota Keluaran
Hey Traders,Stop guessing what the market data means. The new TradFi Pressure Score (TFPS) v89 is here, and it's a complete paradigm shift.
We've evolved TFPS from a simple data dashboard into an intelligent trading assistant that does the heavy lifting for you. It no longer just shows you the numbers; it tells you the story behind them.
🧠 INTRODUCING THE "TRADE THESIS" ENGINE
This is the new core of TFPS. Our algorithm now analyzes the score, z-score extremes, momentum shifts, and market influence (R²) in real-time to generate a clear, actionable trading thesis right on your chart.
Get simple, powerful insights like:
"BULLISH REVERSAL POTENTIAL"
"BEARISH MOMENTUM IGNITION"
"LOW TRADFI INFLUENCE" (telling you to focus on price action instead!)
📊 WHAT ELSE IS NEW IN v89?
Redesigned Intelligence Dashboard: We've thrown out the old data table. The new UI is inspired by professional trading dashboards, focusing on what truly matters: the final analysis and trade idea.
⏰ Live NYSE Market Status: The dashboard now tracks the NYSE session in real-time. Know instantly when institutional liquidity is driving the market and when the TFPS signal carries the most weight.
Smarter Visuals & Streamlined Code: We've enhanced the entire user experience and completely refactored the code for maximum performance and reliability, removing unnecessary complexities like the old JSON alerts.
THE EVOLUTION:
TFPS v65: Gave you the WHAT (the data).
TFPS v89: Gives you the SO WHAT (the actionable insight).
This is the tool we've always wanted to build. It's designed to bring clarity to your trading by bridging the gap between raw data and confident decision-making.
Add it to your chart now and experience the next generation of macro analysis!
- ayana aiLab -
Nota Keluaran
We forgot our Tooltips on the last one, they are back now...Skrip dilindungi
Skrip ini diterbitkan sebagai sumber tertutup. Akan tetapi, anda boleh menggunakannya secara bebas dan tanpa apa-apa had – ketahui lebih di sini.
ayana-ailab | Trade the cause, not the effect. Our "TradFi Pressure Score" reveals what truly moves the crypto market (S&P 500, VIX, DXY). Your AI-powered edge, delivered in a single indicator. ► Find our tools on TradingView.
Penafian
Maklumat dan penerbitan adalah tidak bertujuan, dan tidak membentuk, nasihat atau cadangan kewangan, pelaburan, dagangan atau jenis lain yang diberikan atau disahkan oleh TradingView. Baca lebih dalam Terma Penggunaan.
Skrip dilindungi
Skrip ini diterbitkan sebagai sumber tertutup. Akan tetapi, anda boleh menggunakannya secara bebas dan tanpa apa-apa had – ketahui lebih di sini.
ayana-ailab | Trade the cause, not the effect. Our "TradFi Pressure Score" reveals what truly moves the crypto market (S&P 500, VIX, DXY). Your AI-powered edge, delivered in a single indicator. ► Find our tools on TradingView.
Penafian
Maklumat dan penerbitan adalah tidak bertujuan, dan tidak membentuk, nasihat atau cadangan kewangan, pelaburan, dagangan atau jenis lain yang diberikan atau disahkan oleh TradingView. Baca lebih dalam Terma Penggunaan.