OPEN-SOURCE SCRIPT
RSI Curl Signals 70 / 60 / 40
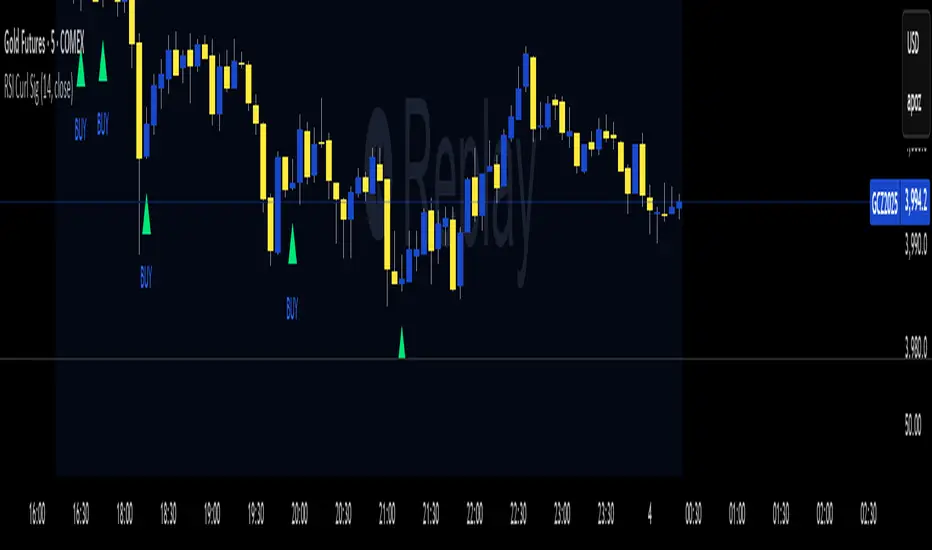
This Indicator Identifies the turning points on the RSI and plots a buy and sell signal on the chart It plots on crossing up above the 41 Level on the RSI and plots a sell curling below the 60 level use a standard RSI on chart if needed with alerts set at RSI curling up above value 40 Level and use an alert for curling below Level 60 use support and resistance for confirmation
Works with any timeframe Ans any asset
Works with any timeframe Ans any asset
Skrip sumber terbuka
Dalam semangat sebenar TradingView, pencipta skrip ini telah menjadikannya sumber terbuka supaya pedagang dapat menilai dan mengesahkan kefungsiannya. Terima kasih kepada penulis! Walaupun anda boleh menggunakannya secara percuma, ingat bahawa menerbitkan semula kod ini adalah tertakluk kepada Peraturan Dalaman kami.
Penafian
Maklumat dan penerbitan adalah tidak dimaksudkan untuk menjadi, dan tidak membentuk, nasihat untuk kewangan, pelaburan, perdagangan dan jenis-jenis lain atau cadangan yang dibekalkan atau disahkan oleh TradingView. Baca dengan lebih lanjut di Terma Penggunaan.