OPEN-SOURCE SCRIPT
Custom EMA Zone
1. Overview
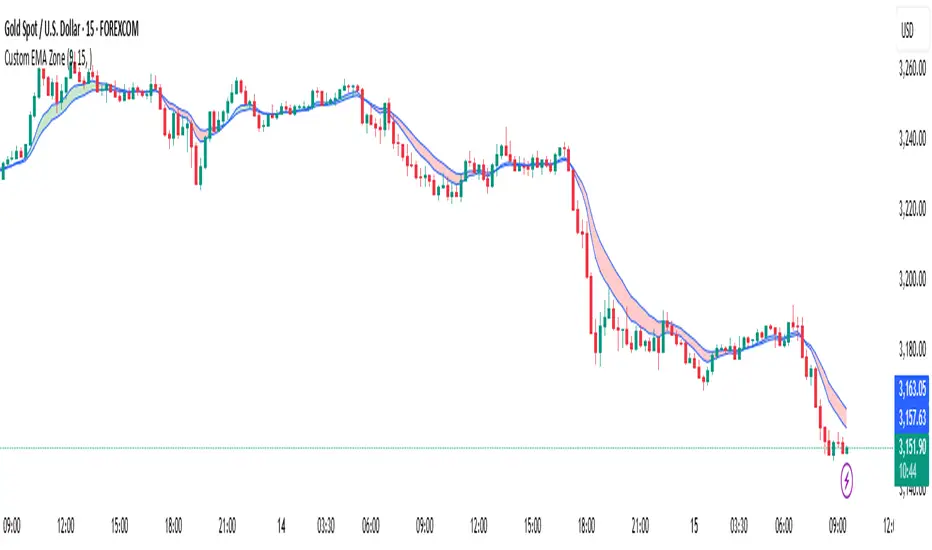
The Custom EMA Cloud Indicator is a technical analysis tool designed to visually display a dynamic zone (or cloud) between two user-defined EMAs. It supports different EMA lengths and allows users to calculate these EMAs using custom timeframes. This flexibility makes it a powerful tool for identifying trends, key price zones, and potential trade signals.
2. Components of the Indicator
2.1. Exponential Moving Averages (EMAs)
EMA 1 (Faster EMA): Calculated using a shorter period (e.g., 21).
EMA 2 (Slower EMA): Calculated using a longer period (e.g., 50).
Users can customize the periods for both EMAs.
2.2. Timeframe Customization
Each EMA can be calculated using a higher timeframe than the chart’s timeframe (e.g., calculate EMA 50 on a 1-hour chart while viewing on a 5-minute chart).
This feature allows users to incorporate higher timeframe trend context into lower timeframe charts.
2.3. Cloud Zone
The cloud is the shaded area between EMA 1 and EMA 2.
Color Logic:
Light Green: Price opens and closes above both EMAs (bullish momentum).
Light Red: Price opens and closes below both EMAs (bearish momentum).
3. How to Use the Indicator
3.1. Trend Identification
When the entire price action is above the cloud, it signals a probable uptrend.
When the entire price action is below the cloud, it indicates a probable downtrend.
When the price is inside the cloud, it reflects probable market consolidation or indecision.
4. Use Cases in Trading Styles
4.1. Scalping
Use short EMAs (e.g., EMA 5 and EMA 13) on 1-minute or 3-minute charts.
Ideal for quick entries and exits during strong momentum moves.
4.2. Swing Trading
Use longer EMAs (e.g., EMA 21 and EMA 50) on 4-hour or daily charts.
Helps capture trend continuation over multiple days.
4.3. Trend Following
Combine with RSI or MACD to confirm trend strength before entering trades.
Stay in the trade as long as price respects the cloud direction.
5. Advantages
Visual Clarity: Simplifies decision-making with clearly defined zones.
Multi-Timeframe Insight: Offers a higher timeframe trend reference.
Customizable: Fits various strategies through adjustable EMAs and timeframes.
6. Limitations
Lagging Nature: As with all moving averages, there may be lag during fast reversals.
False Signals in Sideways Markets: May produce whipsaws during consolidation
Skrip sumber terbuka
Dalam semangat TradingView sebenar, pencipta skrip ini telah menjadikannya sumber terbuka, jadi pedagang boleh menilai dan mengesahkan kefungsiannya. Terima kasih kepada penulis! Walaupuan anda boleh menggunakan secara percuma, ingat bahawa penerbitan semula kod ini tertakluk kepada Peraturan Dalaman.
Penafian
Maklumat dan penerbitan adalah tidak bertujuan, dan tidak membentuk, nasihat atau cadangan kewangan, pelaburan, dagangan atau jenis lain yang diberikan atau disahkan oleh TradingView. Baca lebih dalam Terma Penggunaan.