shock detecter [WS]
if you want free version

usually volaility and volume come together,
but if volume is high and volatility is low,
than blue bar increase.
I named it "abnormal volume shock"
so,
blue signal come only if low volatility + high volume.
blue can come when the price is top(or bottom) but this is not a buy(or sell) signal.
(remember, blue is just a strange moment. high volume + low volatility is not a normal situation. you better to focus "why suddenly volume increased" )
briefly,
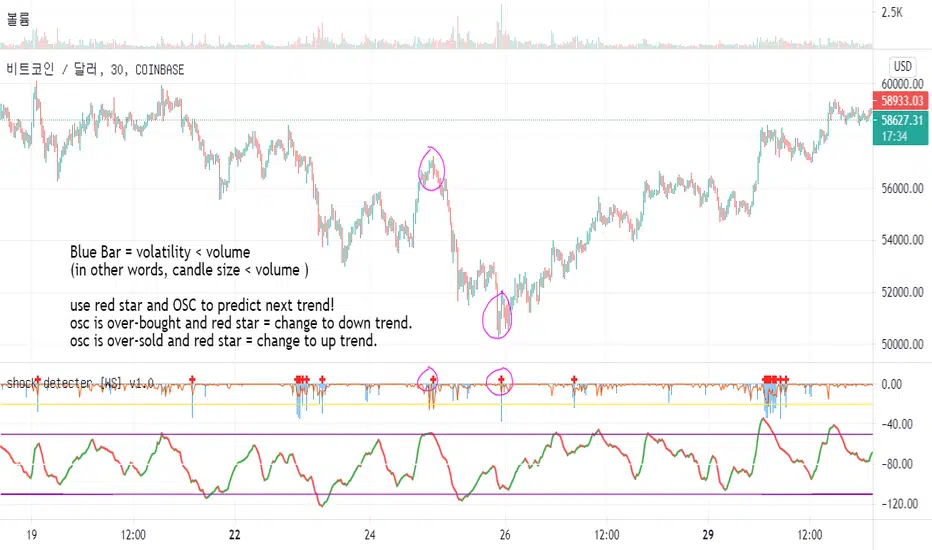
Blue Bar = volatility < volume
(in other words, candle size < volume )
use red star and OSC to predict next trend!
osc is over-bought and red star = change to down trend.
osc is over-sold and red star = change to up trend.
if simple_mode off,
green star = volume shock
orange star = volume shock over threshold (20)
green bar = volatility shock
yellow star = volatility shock over threshold (20)
red bar = volatility reducing (convergence)
white star = end of convergence
Skrip jemputan sahaja
Hanya pengguna disahkan oleh penulis boleh mengakses skrip ini. Anda perlu memohon dan mendapatkan kebenaran untuk menggunakannya. Keizinan selalunya diberikan selepas pembayaran. Untuk lebih butiran, ikuti arahan penulis di bawah atau hubungi shm837 secara terus.
TradingView TIDAK menyarankan pembayaran atau penggunaan skrip kecuali anda mempercayai sepenuhnya penulis dan memahami bagaimana ia berfungsi. Anda juga boleh menjumpai alternatif sumber terbuka dan percuma yang lain di dalam skrip komuniti kami.
Arahan penulis
Penafian
Skrip jemputan sahaja
Hanya pengguna disahkan oleh penulis boleh mengakses skrip ini. Anda perlu memohon dan mendapatkan kebenaran untuk menggunakannya. Keizinan selalunya diberikan selepas pembayaran. Untuk lebih butiran, ikuti arahan penulis di bawah atau hubungi shm837 secara terus.
TradingView TIDAK menyarankan pembayaran atau penggunaan skrip kecuali anda mempercayai sepenuhnya penulis dan memahami bagaimana ia berfungsi. Anda juga boleh menjumpai alternatif sumber terbuka dan percuma yang lain di dalam skrip komuniti kami.