Merek Equal Highs and Lows
Description:
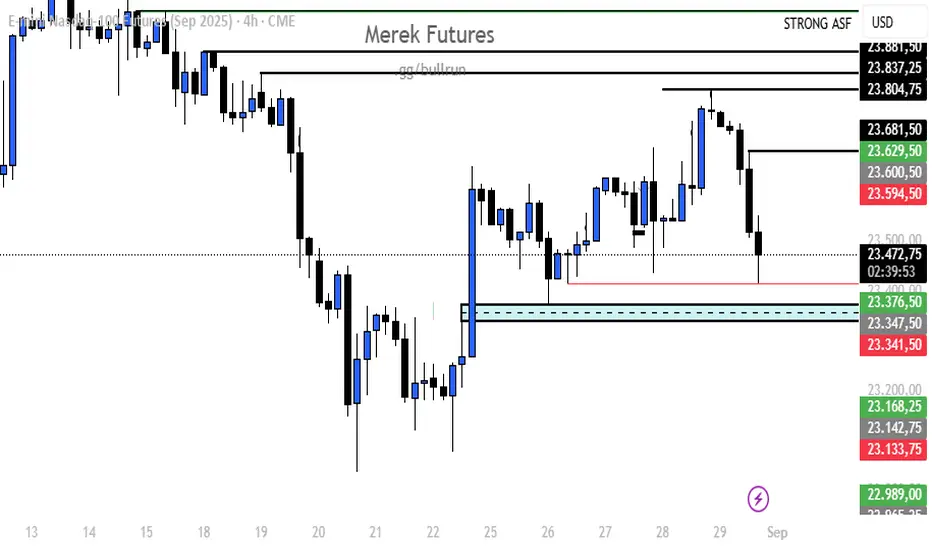
The EQH indicator detects Equal Highs on the chart. This occurs when price reaches the same high level two or more times without breaking it decisively.
Interpretation:
Liquidity zone: Equal highs are often seen as areas where liquidity (stop-loss clusters) is located.
Breakout potential: A break above this level often signals that liquidity is being taken before either a reversal or continuation of the trend.
Market structure: EQH highlights resistance areas that can serve as key decision points for traders.
Use cases:
Identifying potential stop-hunt zones
Spotting resistance levels
Anticipating liquidity grabs before reversals or trend continuations
EQL – Equal Lows Indicator
Description:
The EQL indicator detects Equal Lows on the chart. This occurs when price reaches the same low level two or more times without breaking lower.
Interpretation:
Liquidity zone: Equal lows are areas where liquidity (sell-side stops) tends to accumulate.
Breakout potential: A move below this level often indicates liquidity being swept before a possible reversal or continuation.
Market structure: EQL highlights support areas that can be critical for trade decisions.
Use cases:
Identifying sell-side liquidity zones
Spotting support levels
Recognizing possible stop-hunts before reversals or trend continuations
Skrip jemputan sahaja
Hanya pengguna disahkan oleh penulis boleh mengakses skrip ini. Anda perlu memohon dan mendapatkan kebenaran untuk menggunakannya. Keizinan selalunya diberikan selepas pembayaran. Untuk lebih butiran, ikuti arahan penulis di bawah atau hubungi Merek_Real secara terus.
TradingView TIDAK menyarankan pembayaran atau penggunaan skrip kecuali anda mempercayai sepenuhnya penulis dan memahami bagaimana ia berfungsi. Anda juga boleh menjumpai alternatif sumber terbuka dan percuma yang lain di dalam skrip komuniti kami.
Arahan penulis
Penafian
Skrip jemputan sahaja
Hanya pengguna disahkan oleh penulis boleh mengakses skrip ini. Anda perlu memohon dan mendapatkan kebenaran untuk menggunakannya. Keizinan selalunya diberikan selepas pembayaran. Untuk lebih butiran, ikuti arahan penulis di bawah atau hubungi Merek_Real secara terus.
TradingView TIDAK menyarankan pembayaran atau penggunaan skrip kecuali anda mempercayai sepenuhnya penulis dan memahami bagaimana ia berfungsi. Anda juga boleh menjumpai alternatif sumber terbuka dan percuma yang lain di dalam skrip komuniti kami.