Smoothed Candles
How should I use it ? This is just a example to be used with this indicator.
Let's assume that we are looking for sell opportunities.
- step 1: identify some (at least 3) positives (green) candles with a good volume, excluding consolidation regions.
- step 2: wait for negative (red) candles with a good volume and also all previous candles must be by majority green.
- step 3: wait for pullback with high volume or consolidation region to close the position.
The example can be better described in the image below:
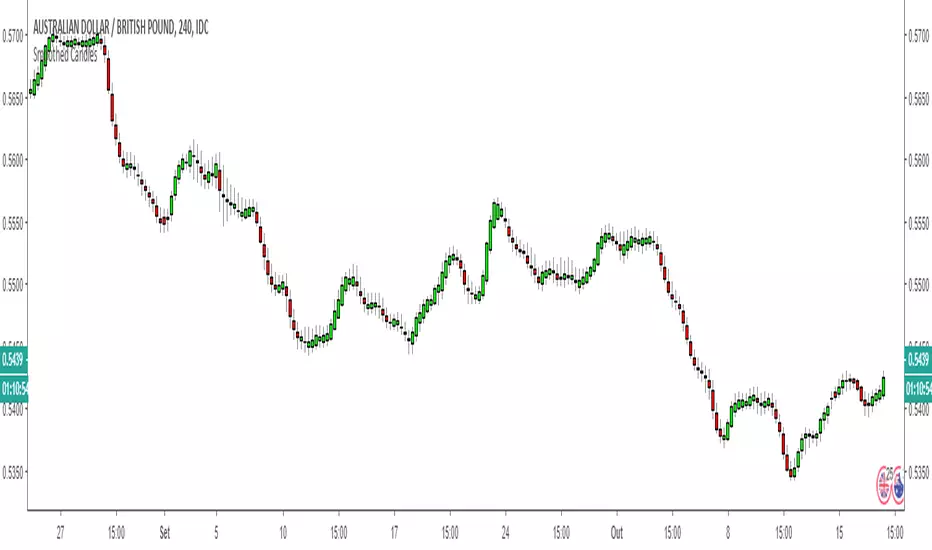
Another example os use, displayed in the image below:
Look how makes it easy to identify tops and bottoms.
Very easy to indetify trends:
Very easy to indetify pullbacks:
It can be used with almost of pairs!
If you are interested in purchase, access the link below:
2450ca2f.ngrok.io/home
Skrip jemputan sahaja
Hanya pengguna disahkan oleh penulis boleh mengakses skrip ini. Anda perlu memohon dan mendapatkan kebenaran untuk menggunakannya. Keizinan selalunya diberikan selepas pembayaran. Untuk lebih butiran, ikuti arahan penulis di bawah atau hubungi FranciscoBiaso secara terus.
TradingView TIDAK menyarankan pembayaran atau penggunaan skrip kecuali anda mempercayai sepenuhnya penulis dan memahami bagaimana ia berfungsi. Anda juga boleh menjumpai alternatif sumber terbuka dan percuma yang lain di dalam skrip komuniti kami.
Arahan penulis
Penafian
Skrip jemputan sahaja
Hanya pengguna disahkan oleh penulis boleh mengakses skrip ini. Anda perlu memohon dan mendapatkan kebenaran untuk menggunakannya. Keizinan selalunya diberikan selepas pembayaran. Untuk lebih butiran, ikuti arahan penulis di bawah atau hubungi FranciscoBiaso secara terus.
TradingView TIDAK menyarankan pembayaran atau penggunaan skrip kecuali anda mempercayai sepenuhnya penulis dan memahami bagaimana ia berfungsi. Anda juga boleh menjumpai alternatif sumber terbuka dan percuma yang lain di dalam skrip komuniti kami.