OPEN-SOURCE SCRIPT
Vrext- Advanced EMA Zone
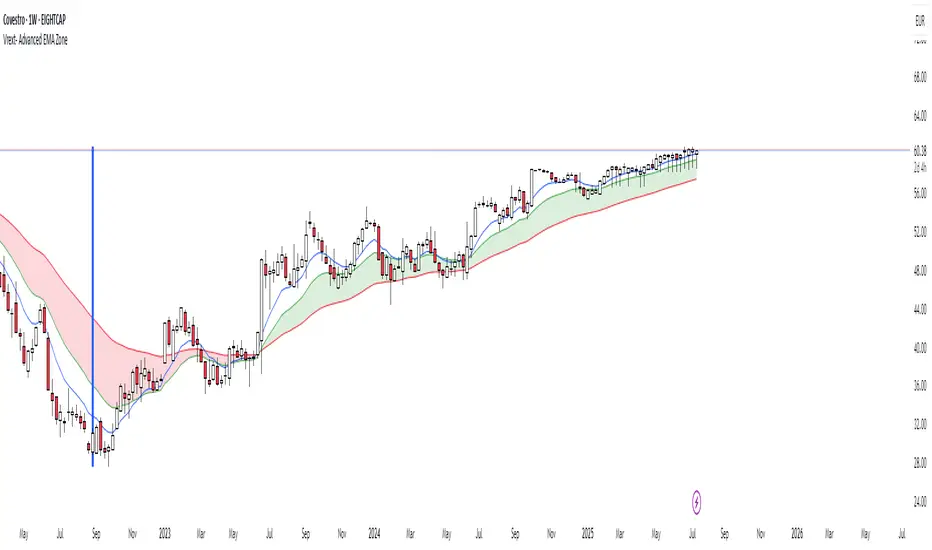
The indicator highlights an area between two manually adjustable EMA-s to visibly mark a zone. A zone where the larger EMA is bellow the smaller one (indicating an uptrend) is marked green. On the opposite hand where higher EMA is above the lower the zone (indicating a downtrend) is marked red.
For correct zone marking enter EMA-s in descending order.
The indicator also allows you to add further additional EMA-s, which do not have a zone drawn between them and are just stand alone EMA-s. They are fully customisable in terms of colour, width. etc.
Additionally the indicator allows you to plot a vertical line ''xyz'' candles in the past. The idea behind it is that if you want to only focus on the previous 150 candles, there will be a clear line at the 150th candle for easier navigating.
Skrip sumber terbuka
Dalam semangat TradingView sebenar, pencipta skrip ini telah menjadikannya sumber terbuka, jadi pedagang boleh menilai dan mengesahkan kefungsiannya. Terima kasih kepada penulis! Walaupuan anda boleh menggunakan secara percuma, ingat bahawa penerbitan semula kod ini tertakluk kepada Peraturan Dalaman.
Penafian
Maklumat dan penerbitan adalah tidak bertujuan, dan tidak membentuk, nasihat atau cadangan kewangan, pelaburan, dagangan atau jenis lain yang diberikan atau disahkan oleh TradingView. Baca lebih dalam Terma Penggunaan.