OPEN-SOURCE SCRIPT
Trend v4.0 Another update
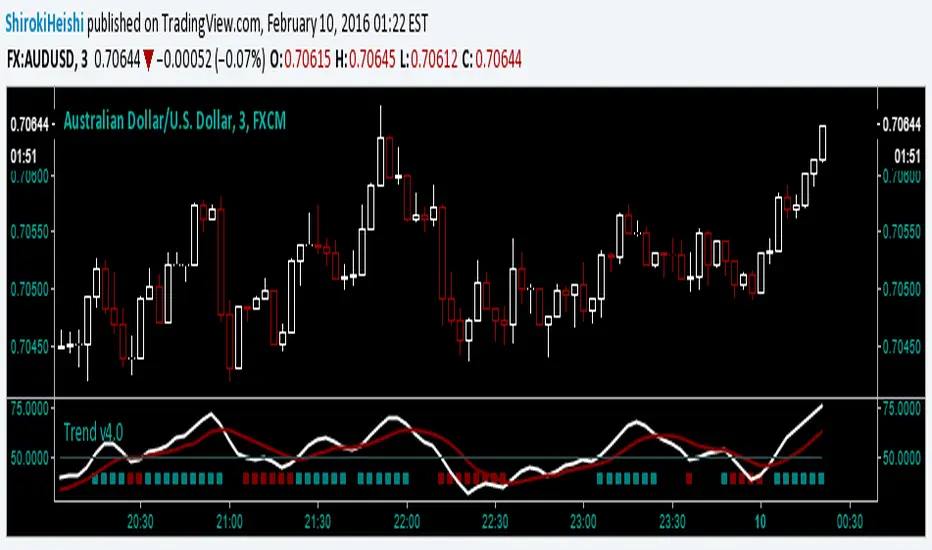
Yet another update, default settings can be customized to your needs. Be aware that while this is similar to the other versions, this can only repaint an active bar, but that slows it down by one period. You are warned. Be that as it may, the basic idea is the same; trying to capture the really strong moves into overbought or oversold territory as defined by Relative Strength index. In RSI mode, you can see the smoothing has slowed it down a bit, but warrants backtesting.
First green bar go long, First red bar go short, first white bar possible trend exhaustion. Or use crossovers and such, play with the inputs OB/OS, RSI length, signal length, tick length, swing length, as I said customize to your tastes. I offer no surety as to its efficacy, but we all learn.
Trade Responsibly,
Shiroki
Skrip sumber terbuka
Dalam semangat sebenar TradingView, pencipta skrip ini telah menjadikannya sumber terbuka supaya pedagang dapat menilai dan mengesahkan kefungsiannya. Terima kasih kepada penulis! Walaupun anda boleh menggunakannya secara percuma, ingat bahawa menerbitkan semula kod ini adalah tertakluk kepada Peraturan Dalaman kami.
Penafian
Maklumat dan penerbitan adalah tidak dimaksudkan untuk menjadi, dan tidak membentuk, nasihat untuk kewangan, pelaburan, perdagangan dan jenis-jenis lain atau cadangan yang dibekalkan atau disahkan oleh TradingView. Baca dengan lebih lanjut di Terma Penggunaan.