Relative Breadth Index
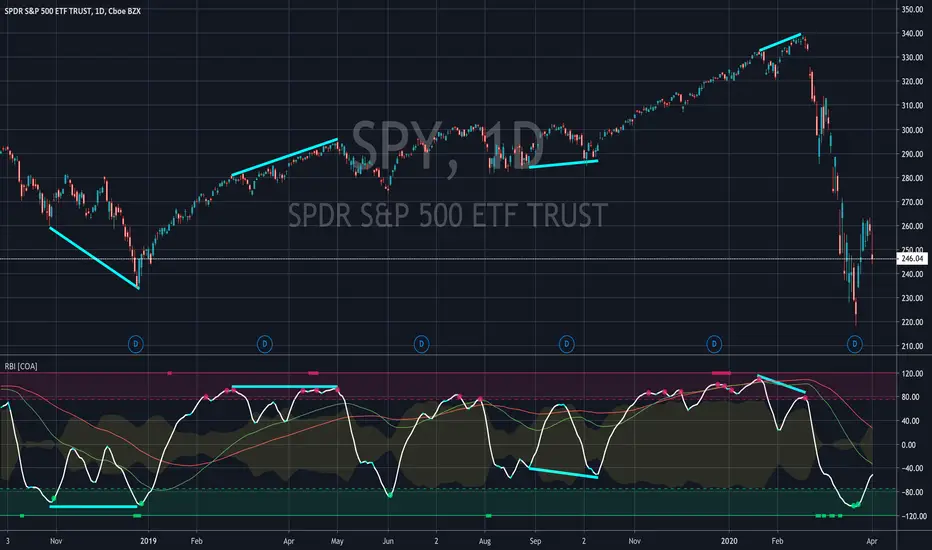
Relative Breadth Index has 4 main components:
- Fast (White), Medium (Green), and Slow (Red) Oscillators
- Overbought and Oversold Thresholds (Shaded Areas)
- Pulse (Yellow)
- Divergence Indicator (Rectangles)
How does it work?
- The Medium and Slow Oscillators indicate the general trend.
- The Fast Oscillator shows what price action is doing in reference to that trend.
- Pulse suggests the probability that the current move (Fast) is an end of the trend defined by the Medium and Slow lines.
- The Divergence Indicator also suggests a reversal and to look for divergences between the Fast line and price action.
What are the signals?
- In general: green signals are bullish, red are bullish
- Rectangles: Look for a divergence
- Circles: Sell and buy signals
- Triangles: Stronger sell and buy signals
- Triangles: Reversal signal
What about the Pulse?
- If Pulse is low, a signal may only be a short-lived move.
- If Pulse is high, a signal may be a full-on trend reversal.
For access, please DM us or visit the link below in our Signature.
Skrip jemputan sahaja
Hanya pengguna disahkan oleh penulis boleh mengakses skrip ini. Anda perlu memohon dan mendapatkan kebenaran untuk menggunakannya. Keizinan selalunya diberikan selepas pembayaran. Untuk lebih butiran, ikuti arahan penulis di bawah atau hubungi CoinObservatory secara terus.
TradingView TIDAK menyarankan pembayaran atau penggunaan skrip kecuali anda mempercayai sepenuhnya penulis dan memahami bagaimana ia berfungsi. Anda juga boleh menjumpai alternatif sumber terbuka dan percuma yang lain di dalam skrip komuniti kami.
Arahan penulis
For access to our TradingView scripts, visit us at
linktr.ee/coinobs
Penafian
Skrip jemputan sahaja
Hanya pengguna disahkan oleh penulis boleh mengakses skrip ini. Anda perlu memohon dan mendapatkan kebenaran untuk menggunakannya. Keizinan selalunya diberikan selepas pembayaran. Untuk lebih butiran, ikuti arahan penulis di bawah atau hubungi CoinObservatory secara terus.
TradingView TIDAK menyarankan pembayaran atau penggunaan skrip kecuali anda mempercayai sepenuhnya penulis dan memahami bagaimana ia berfungsi. Anda juga boleh menjumpai alternatif sumber terbuka dan percuma yang lain di dalam skrip komuniti kami.
Arahan penulis
For access to our TradingView scripts, visit us at
linktr.ee/coinobs