OPEN-SOURCE SCRIPT
Telah dikemas kini Staggered Exponential Pullbacks
Indicator Description: Staggered Exponential Pullbacks (Final)
Core Concept
This indicator is designed to dynamically track and visualize price pullbacks from a recent high. It serves as an intelligent alert system and a tool for visualizing potential support levels that follow a predefined, non-linear logic.
Instead of a fixed percentage interval, the indicator calculates the levels based on a fixed, exponentially increasing sequence of percentages. The distance between the levels increases as the price falls further. This models a strategy where larger price movements are tolerated as a pullback deepens before the next signal level is reached. The basis for this calculation is always the highest close of the last x candles.
Key Features
This indicator goes far beyond a simple calculation, offering a range of intelligent features for professional use:
Cascading, Fixed Levels: The levels are based on a fixed sequence of percentage distances (3.0%, 3.6%, 4.3%, etc.), where each new level is calculated from the previous level.
Persistent Support Levels ("Floors"): Once an alert level is breached, it transforms into a fixed support line ("floor"). This line will never move down, even if the market high subsequently drops.
Automatic Upward Adjustment: Established floors are automatically pulled upwards when the market shows new strength and makes higher highs. A once-reached -3% floor will therefore rise with the market.
Intelligent, Self-Cleaning Reset Logic: The indicator recognizes when a pullback sequence has ended and a new one has begun. "Ghost lines" from old, irrelevant price movements are automatically removed from the chart to ensure maximum clarity.
Cascade-Proof Alerts: Even during extremely fast sell-offs that break through multiple levels in a single candle, the indicator correctly captures every single level breach.
Customizable Visualization: All key parameters, such as the lookback period and the colors of the lines, can be easily adjusted in the settings.
Visual Elements on the Chart
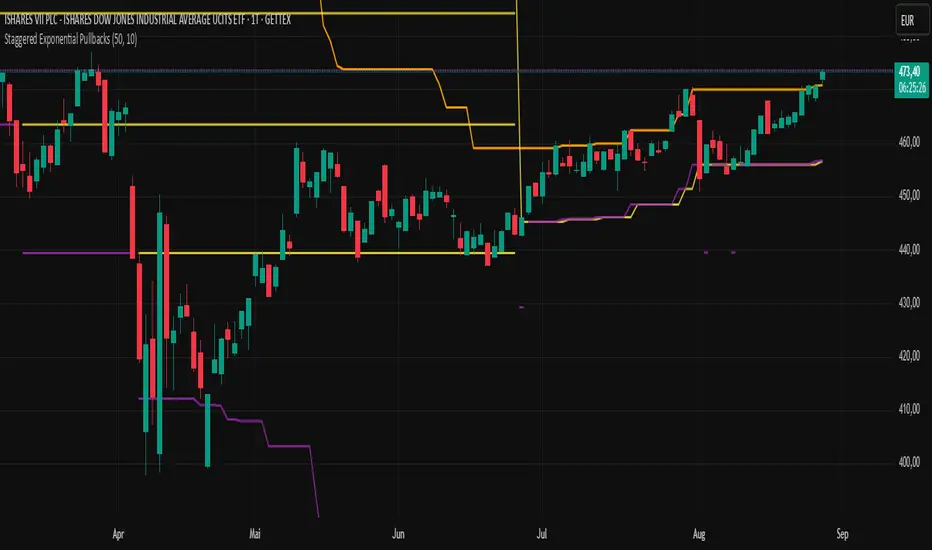
The Orange Line (Highest Close): This is the reference line. It always shows the highest closing price within the defined lookback period and has a step-line shape.
The 'Floor' Lines (Default: Yellow): These are solid lines that indicate which percentage levels have already been breached in the current sequence. They function as established support levels.
The 'Next Due' Line (Default: Purple): This is a step-line that displays the next expected alert level. It moves dynamically with the calculation. As soon as the price crosses this line, an alert is triggered, and it transforms into a yellow "Floor" line.
Settings (Inputs)
Number of Candles (Lookback): Defines how many past candles are used to determine the highest closing price.
Displayed Alert Levels (Max 10): Determines the maximum number of levels the indicator will calculate and display.
Color of Floors: Allows you to freely choose the color for the solid, established support lines.
Color of Next Due Line: Allows you to freely choose the color for the next, untriggered alert line.
Setting Up Alerts (Important!)
Since the indicator uses dynamic alert messages, the alert must be set up as follows:
Add the indicator to the chart.
Click the clock icon ("Alert") in the top toolbar.
In the "Condition" field, select the name of this indicator: Staggered Exponential Pullbacks.
In the second dropdown menu, you must select the option "Any alert() function call".
Message: The message box can be left empty. The indicator automatically generates a detailed message (e.g., "Price Alert: Level 2 (3.6%) reached!").
Click "Create".
You only need one single alert to cover all 10 levels.
Important Disclaimer: Not Financial Advice
This indicator is purely a technical analysis tool for visualizing price movements. The displayed lines and triggered alerts do not constitute buy or sell recommendations and are not a form of financial or investment advice. They serve for informational and analytical purposes only.
Trading decisions based on the information from this indicator are made solely at your own risk and responsibility. The author and developer of this script assume no liability for any trading losses. Always conduct your own comprehensive analysis and, if necessary, consult a qualified financial advisor before making any trading decisions.
Core Concept
This indicator is designed to dynamically track and visualize price pullbacks from a recent high. It serves as an intelligent alert system and a tool for visualizing potential support levels that follow a predefined, non-linear logic.
Instead of a fixed percentage interval, the indicator calculates the levels based on a fixed, exponentially increasing sequence of percentages. The distance between the levels increases as the price falls further. This models a strategy where larger price movements are tolerated as a pullback deepens before the next signal level is reached. The basis for this calculation is always the highest close of the last x candles.
Key Features
This indicator goes far beyond a simple calculation, offering a range of intelligent features for professional use:
Cascading, Fixed Levels: The levels are based on a fixed sequence of percentage distances (3.0%, 3.6%, 4.3%, etc.), where each new level is calculated from the previous level.
Persistent Support Levels ("Floors"): Once an alert level is breached, it transforms into a fixed support line ("floor"). This line will never move down, even if the market high subsequently drops.
Automatic Upward Adjustment: Established floors are automatically pulled upwards when the market shows new strength and makes higher highs. A once-reached -3% floor will therefore rise with the market.
Intelligent, Self-Cleaning Reset Logic: The indicator recognizes when a pullback sequence has ended and a new one has begun. "Ghost lines" from old, irrelevant price movements are automatically removed from the chart to ensure maximum clarity.
Cascade-Proof Alerts: Even during extremely fast sell-offs that break through multiple levels in a single candle, the indicator correctly captures every single level breach.
Customizable Visualization: All key parameters, such as the lookback period and the colors of the lines, can be easily adjusted in the settings.
Visual Elements on the Chart
The Orange Line (Highest Close): This is the reference line. It always shows the highest closing price within the defined lookback period and has a step-line shape.
The 'Floor' Lines (Default: Yellow): These are solid lines that indicate which percentage levels have already been breached in the current sequence. They function as established support levels.
The 'Next Due' Line (Default: Purple): This is a step-line that displays the next expected alert level. It moves dynamically with the calculation. As soon as the price crosses this line, an alert is triggered, and it transforms into a yellow "Floor" line.
Settings (Inputs)
Number of Candles (Lookback): Defines how many past candles are used to determine the highest closing price.
Displayed Alert Levels (Max 10): Determines the maximum number of levels the indicator will calculate and display.
Color of Floors: Allows you to freely choose the color for the solid, established support lines.
Color of Next Due Line: Allows you to freely choose the color for the next, untriggered alert line.
Setting Up Alerts (Important!)
Since the indicator uses dynamic alert messages, the alert must be set up as follows:
Add the indicator to the chart.
Click the clock icon ("Alert") in the top toolbar.
In the "Condition" field, select the name of this indicator: Staggered Exponential Pullbacks.
In the second dropdown menu, you must select the option "Any alert() function call".
Message: The message box can be left empty. The indicator automatically generates a detailed message (e.g., "Price Alert: Level 2 (3.6%) reached!").
Click "Create".
You only need one single alert to cover all 10 levels.
Important Disclaimer: Not Financial Advice
This indicator is purely a technical analysis tool for visualizing price movements. The displayed lines and triggered alerts do not constitute buy or sell recommendations and are not a form of financial or investment advice. They serve for informational and analytical purposes only.
Trading decisions based on the information from this indicator are made solely at your own risk and responsibility. The author and developer of this script assume no liability for any trading losses. Always conduct your own comprehensive analysis and, if necessary, consult a qualified financial advisor before making any trading decisions.
Nota Keluaran
Update Notes: Correction to Alert Trigger Logic1. The Identified Issue
A critical issue was identified in the alert trigger logic of the previous version. An alert could be triggered prematurely during the formation of the current, live candle. This could lead to false alarms if the price temporarily crossed a level intra-bar but closed back above it by the end of the period. The indicator's core principle is to operate only on confirmed, closed candle data.
2. The Root Cause
The root cause was the use of the real-time close variable in the trigger condition (ta.crossunder(close, ...)). In Pine Script, close on a live bar refers to the current, real-time price, not its final closing price. This meant the check was happening against live data instead of historical, finalized data.
3. The Solution Implemented
The logic has been fundamentally corrected to operate exclusively on closed, historical data. The trigger condition has been shifted one bar into the past.
Old Logic: ta.crossunder(close, alarmLevel[1]) (Checked if the live price today was crossing the line from yesterday).
New Logic: ta.crossunder(close[1], alarmLevel[2]) (Checks if the closing price of yesterday crossed the line from the day before yesterday).
4. The Resulting Behavior
The alert is now triggered reliably and correctly at the opening of the new bar, confirming that a valid crossover occurred at the close of the previous bar. This ensures that alarms are only generated based on confirmed, final price data and prevents any false signals from real-time price fluctuations. The indicator's behavior is now 100% based on historical analysis, as originally intended.
Nota Keluaran
The original bug has only just been fixed. The last update was still buggy.Skrip sumber terbuka
Dalam semangat TradingView sebenar, pencipta skrip ini telah menjadikannya sumber terbuka, jadi pedagang boleh menilai dan mengesahkan kefungsiannya. Terima kasih kepada penulis! Walaupuan anda boleh menggunakan secara percuma, ingat bahawa penerbitan semula kod ini tertakluk kepada Peraturan Dalaman.
Penafian
Maklumat dan penerbitan adalah tidak bertujuan, dan tidak membentuk, nasihat atau cadangan kewangan, pelaburan, dagangan atau jenis lain yang diberikan atau disahkan oleh TradingView. Baca lebih dalam Terma Penggunaan.
Skrip sumber terbuka
Dalam semangat TradingView sebenar, pencipta skrip ini telah menjadikannya sumber terbuka, jadi pedagang boleh menilai dan mengesahkan kefungsiannya. Terima kasih kepada penulis! Walaupuan anda boleh menggunakan secara percuma, ingat bahawa penerbitan semula kod ini tertakluk kepada Peraturan Dalaman.
Penafian
Maklumat dan penerbitan adalah tidak bertujuan, dan tidak membentuk, nasihat atau cadangan kewangan, pelaburan, dagangan atau jenis lain yang diberikan atau disahkan oleh TradingView. Baca lebih dalam Terma Penggunaan.