PROTECTED SOURCE SCRIPT
Islamic Tijarat -Dual Relative Strength
Islamic Tijarat - Dual Relative Strength
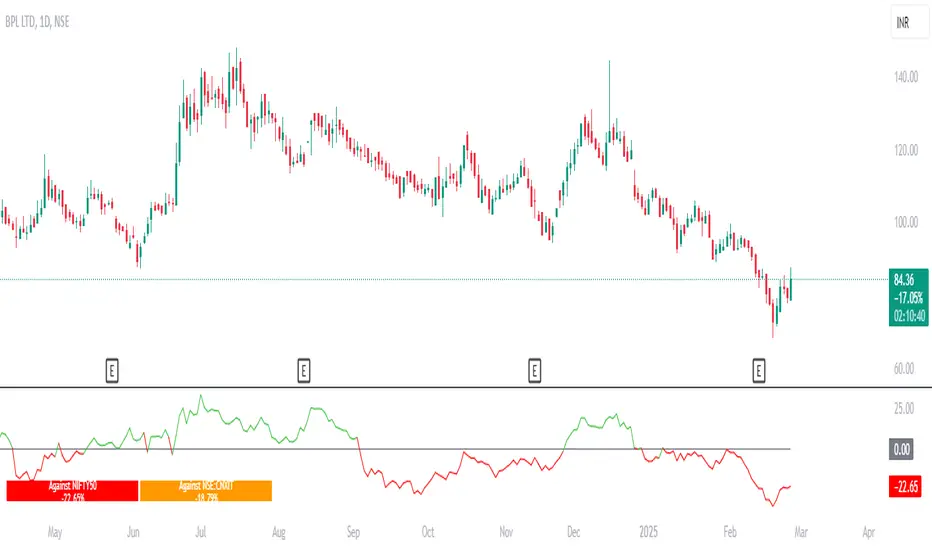
Islamic Tijarat - Dual Relative Strength is a powerful indicator designed to compare the relative performance of two securities, such as a stock against its sector index or Nifty 50 (default benchmark) . This helps traders assess whether a stock is outperforming (> 0) or underperforming (< 0) relative to the chosen benchmark.
Key Features:
✔ Relative Strength Comparison – Measure the performance of a stock relative to Nifty 50, industry index, or sector index.
✔ Multiple Timeframes – Works best on Daily Timeframe (TF) but can also be applied to Weekly, Monthly, or Intraday charts based on the preferred calculation period.
✔ Customizable Calculation Period – Choose the desired number of hours when applying it to smaller timeframes.
✔ Box Table Display – Provides a clear performance comparison against both Nifty 50 and the selected sector index .
✔ Toggle Color Option on Crossovers – Visually highlights significant crossovers in relative strength for better readability.
✔ Enhanced Label Display – Fixed label visibility issue when plot options were disabled.
✔ Superimposed Price Action on RS Line – In addition to standard Relative Strength (RS) behavior, users can now overlay price action movements onto the RS line for a more holistic analysis.
✔ Customizable Moving Averages for RS – Added SMA/EMA (length: 9) to smoothen the RS calculation, helping traders filter noise and identify trends more effectively.
Usage:
✅ Compare stock performance against Nifty 50 , industry index, sector index, or any other security within the same sector.
✅ Identify strength and weakness trends over different timeframes.
✅ Use crossovers, trend direction, and price action integration for better decision-making.
This brings enhanced functionality, improved visualization, and bug fixes, making it a must-have tool for traders focusing on relative strength analysis.
Skrip dilindungi
Skrip ini diterbitkan sebagai sumber tertutup. Akan tetapi, anda boleh menggunakannya secara bebas dan tanpa apa-apa had – ketahui lebih di sini.
Regards
SuperChartz
telegram.me/SuperChartz
Instagram.com/SuperChartz
facebook.com/SuperChartz
twitter.com/SuperChartz
youtube.com/@SuperChart
Get TradingView Premium 👇
in.tradingview.com/?aff_id=130166
SuperChartz
telegram.me/SuperChartz
Instagram.com/SuperChartz
facebook.com/SuperChartz
twitter.com/SuperChartz
youtube.com/@SuperChart
Get TradingView Premium 👇
in.tradingview.com/?aff_id=130166
Penafian
Maklumat dan penerbitan adalah tidak bertujuan, dan tidak membentuk, nasihat atau cadangan kewangan, pelaburan, dagangan atau jenis lain yang diberikan atau disahkan oleh TradingView. Baca lebih dalam Terma Penggunaan.