PROTECTED SOURCE SCRIPT
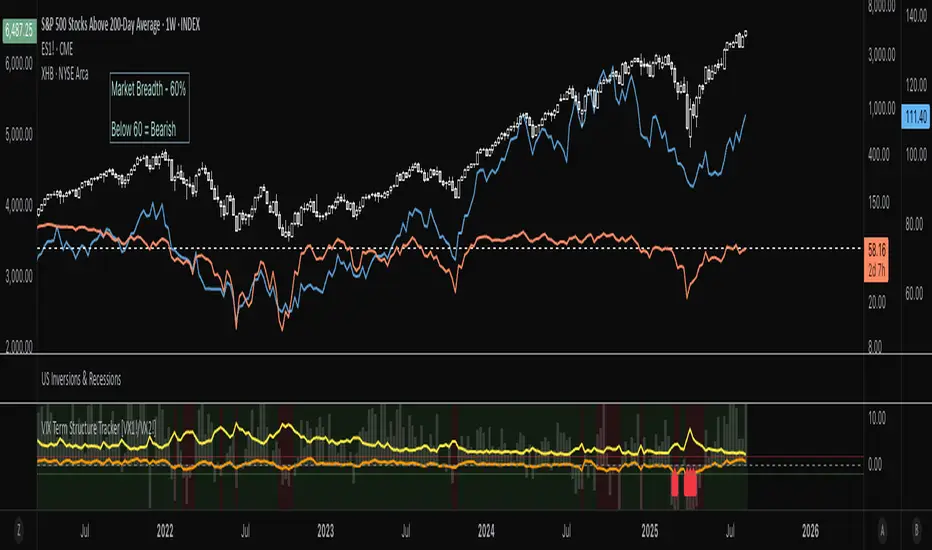
VIX Term Structure Tracker [VX1!/VX2!]
1. Data Preparation
The script starts by fetching four key data series on a daily ("D") timeframe:
VIX (CBOE:VIX): The spot VIX index, a real-time measure of market expectations of future volatility.
VX1! (CBOE:VX1!): The price of the front-month (nearest to expiration) VIX futures contract.
VX2! (CBOE:VX2!): The price of the next-month VIX futures contract.
SPX (SP:SPX): The S&P 500 Index, which serves as a benchmark for the overall market.
2. Term Structure and Market Psychology
The core of the indicator lies in analyzing the relationship between the futures prices.
term_slope = vx2 - vx1: This calculates the difference between the next-month and front-month VIX futures prices.
Contango: If vx2 > vx1, the slope is positive, and the market is in contango. This is the "normal" state, where traders expect volatility to be lower in the future. The script colors this background a light green.
Backwardation: If vx2 < vx1, the slope is negative, and the market is in backwardation. This is a rare state indicating elevated fear. It means traders are willing to pay a premium for short-term protection against volatility, implying that an increase in fear is imminent. The script colors this background a light red.
3. Roll Yield Calculation
roll_yield = ((vx1 - vix) / days_to_expiry) * 100: This calculates the estimated return (or loss) from rolling a futures position from the spot VIX to the front-month future. This is a key metric for understanding the cost of holding VIX futures. A negative roll yield means it is expensive to hold a long VIX position.
4. Equilibrium and Z-Score
This section of the code provides a statistical measure to determine how extreme the current term structure is compared to its historical average.
avg_slope = ta.sma(term_slope, 252): This calculates the one-year simple moving average of the term structure slope.
z_score: This is the most powerful part of the indicator. It measures how many standard deviations the current term_slope is from its one-year average.
A Z-score of +2 or higher indicates the market is in an extreme state of contango (complacency), where volatility is abnormally low.
A Z-score of -2 or lower indicates an extreme state of backwardation (fear), where there's an abnormal surge in short-term volatility expectations.
5. Visualizations & Signals
The script presents a comprehensive view of these metrics on the chart.
plot(term_slope): Shows a blue line representing the VIX term structure slope.
bgcolor(...): Visually highlights periods of contango (light green) and backwardation (light red).
plot(roll_yield): Displays a column chart showing the roll yield, indicating the cost or benefit of holding VIX futures.
plot(z_score): Shows an orange line representing the Z-score, with horizontal lines at +2 and -2 to highlight extreme conditions.
plotshape(...): These are your trading signals. A red arrow pointing up (shape.labelup) appears at the bottom of the chart when the Z-score drops below -2 (extreme backwardation), and a green arrow pointing down (shape.labeldown) appears at the top when the Z-score goes above +2 (extreme contango).
6. Interpretation and Trading Signals
The script provides a clear framework for interpreting market sentiment:
Extreme Backwardation Signal (Red Arrow Up): When the Z-score falls to -2 or below, it signals a period of extreme market fear. This is often an excellent contrarian signal for buying the VIX (or related products) and/or for caution in long equity positions.
Extreme Contango Signal (Green Arrow Down): When the Z-score rises to +2 or above, it signals a period of extreme market complacency. This can be a contrarian signal for selling the VIX (or related products) and/or for potential short-term weakness in the S&P 500.
The VIX/SPX Risk Ratio also provides a good visual of volatility relative to the S&P 500, with an increasing ratio signaling a rising risk environment.
Ultimately, this indicator provides a powerful way to visualize the VIX futures term structure and use statistical analysis (Z-score) to find high-probability signals of extreme market sentiment.
Skrip dilindungi
Skrip ini diterbitkan sebagai sumber tertutup. Akan tetapi, anda boleh menggunakannya secara bebas dan tanpa apa-apa had – ketahui lebih di sini.
Penafian
Maklumat dan penerbitan adalah tidak bertujuan, dan tidak membentuk, nasihat atau cadangan kewangan, pelaburan, dagangan atau jenis lain yang diberikan atau disahkan oleh TradingView. Baca lebih dalam Terma Penggunaan.