OPEN-SOURCE SCRIPT
vdubong updated
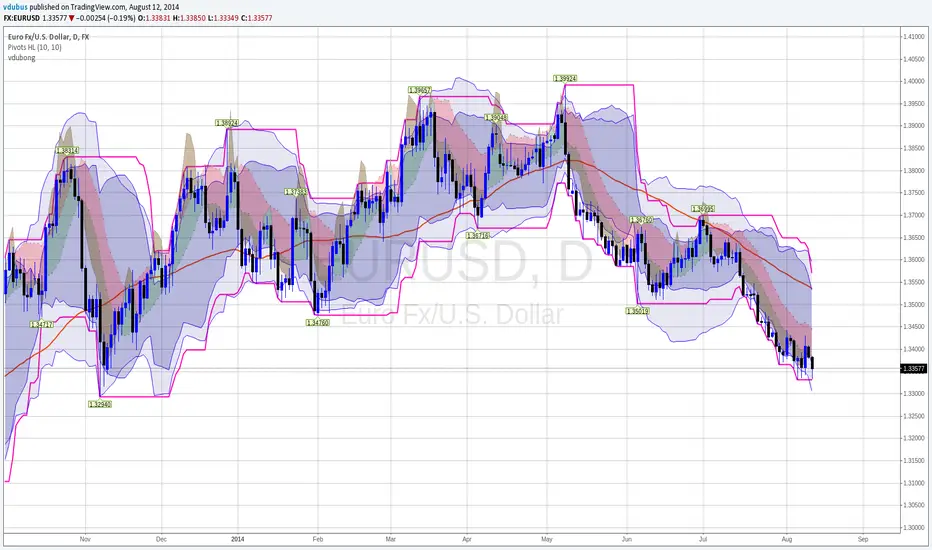
Most the credit for this update has to go to RicardoSantos and his awesome RSIChannel + some fixes to my own which I embedded to my my own script.. I've also embedded the additional Bollinger band 50/2. What can I say it's becoming a thing of beauty :).
RicardoSantos's RSIChannel indicator is also included separately (hidden) should you chose to 'Make it mine'
Made a couple of changes to the script pastebin.com/F5e24Vfu
RicardoSantos's RSIChannel indicator is also included separately (hidden) should you chose to 'Make it mine'
Made a couple of changes to the script pastebin.com/F5e24Vfu
Skrip sumber terbuka
Dalam semangat sebenar TradingView, pencipta skrip ini telah menjadikannya sumber terbuka supaya pedagang dapat menilai dan mengesahkan kefungsiannya. Terima kasih kepada penulis! Walaupun anda boleh menggunakannya secara percuma, ingat bahawa menerbitkan semula kod ini adalah tertakluk kepada Peraturan Dalaman kami.
Penafian
Maklumat dan penerbitan adalah tidak dimaksudkan untuk menjadi, dan tidak membentuk, nasihat untuk kewangan, pelaburan, perdagangan dan jenis-jenis lain atau cadangan yang dibekalkan atau disahkan oleh TradingView. Baca dengan lebih lanjut di Terma Penggunaan.